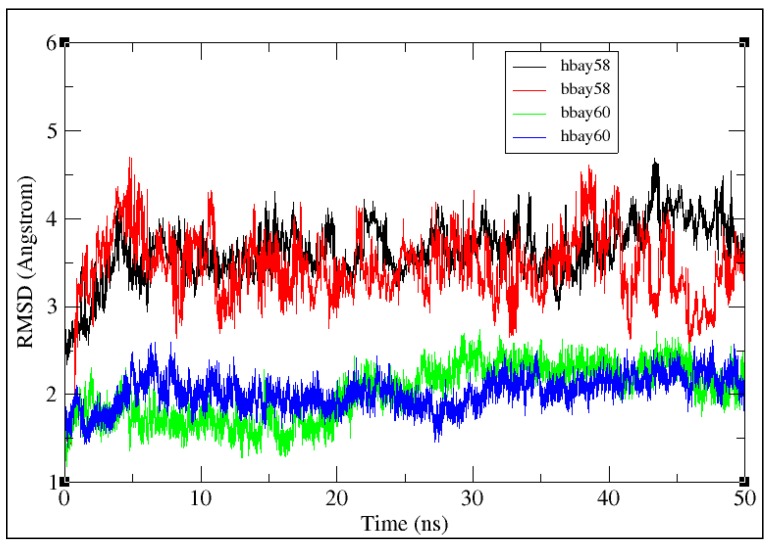
Figure 4.
50 ns RMSD trajactories of the backbone atoms of BAY58-2667 and BAY60-2770 bound bH-NOX and hH-NOX complexes (bbay58, hbay58, bbay60 and hbay60). Y-axis represents the value of RMSD in Angstroms (Å) and the X-axis shows the duration of the simulation trajectory in nanoseconds (ns). All the four trajectories are traced in different colors, BAY58-2667 bound hH-NOX (hbay58) is represented in black; BAY58-2667 bound bH-NOX (bbay58) is shown in red; BAY60-2770 bound bH-NOX (bbay60) is illustrated in green and BAY60-2770 bound hH-NOX (hbay60) is shown in blue.

