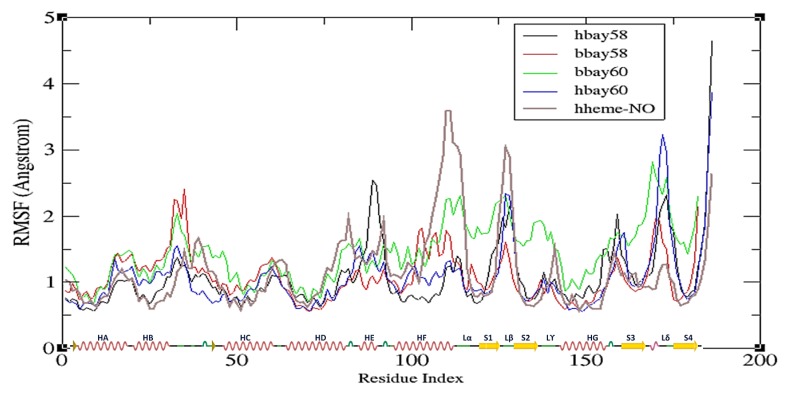
Figure 5.
Average fluctuation experienced by each H-NOX residue, backbone atoms, represented as root mean square fluctuation or RMSF traces: hbay58 (black), bbay58 (red), bbay60 (green), hbay60 (blue) and NO bound heme Fe2+-hH-NOX or hheme-NO (purple) over the course of 50 ns simulation. Y-axis shows RMSF in Angstroms Å and X-axis represents H-NOX residues from N to C terminus (residue index). The X-axis also shows secondary structure layout of the H-NOX structure, helices are represented as red springs, loops as green lines, turns as green curves and strands as yellow arrows.

