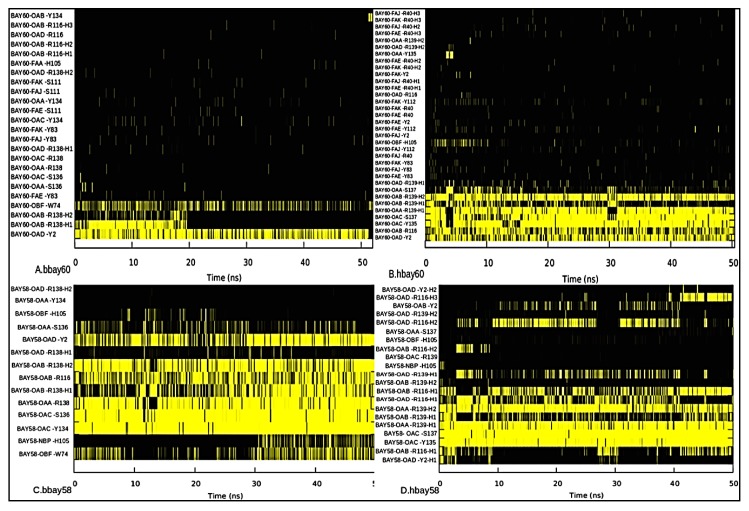
Figure 7.
Hydrogen bond occupancy as observed in bbay60 (A), hbay60 (B), bbay58 (C) and hbay58 (D) complexes during 50 ns simulation period, outlaid at X-axis. Y-axis shows hydrogen bond forming atoms of the BAY compounds and binding residues of H-NOX, the atom abbreviations are same as illustrated in Figure 1. Hydrogen bonds were recorded throughout the 50 ns trajectory in all the four complexes. Yellow bars indicate the event of hydrogen bond formation as observed at that point of time at X-axis. Length of the yellow trace illustrates the occupancy or the time duration for which the respective hydrogen bond was observed.

