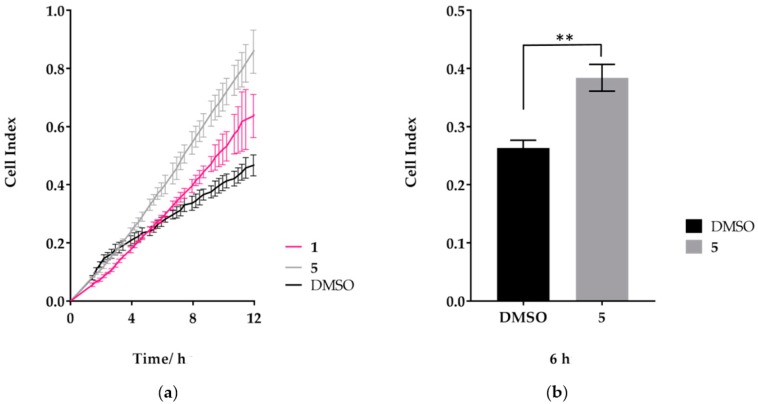
Figure 7.
Kinetics of migration in drug-treated MDA-MB-231 cells. Cell migration in real time was analysed by the xCELLigence RTCA. (a) Shows the average cell indexes over 12 h for each drug treatment, (b) cell migration analysis at 6 h, data shown as mean ± SD of quadruplicate wells and are representative of three independent experiments (n = 3); ** p ≤ 0.01.

