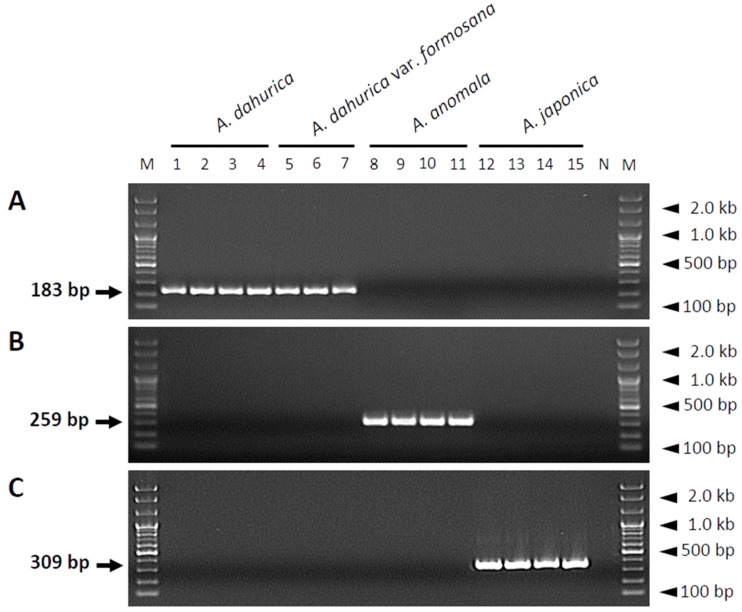
Figure 2.
Gel images showing the amplification of SCAR markers developed from sequence variations in the ITS regions of three Angelica species using species-specific primer pairs. The ITS sequences of A. dahurica (A), A. anomala (B), and A. japonica (C) were amplified using ADA-F/ADA-R, AAN-F/AAN-R, and AJA-F/AJA-R primer pairs, respectively. Primer sequences are listed in Table 3. Lanes 1, 2, 3, and 4 correspond to samples ADA-JS, ADA-TA, ADA-YJ, and ADA-NJ, respectively, of A. dahurica; lanes 5, 6, and 7 correspond to samples ADF-CN1, ADF-CN2, and ADF-CN3, respectively, of A. dahurica var. formosana; lanes 8, 9, 10, and 11 correspond to samples AAN-PC, AAN-JN1, AAN-JN2, and AAN-GW, respectively, of A. anomala; and lanes 12, 13, 14, and 15 correspond to samples AJA-AW, AJA-CJ, AJA-HL, and AJA-PS, respectively, of A. japonica. Details of all of these 15 samples are listed in Table 1. Lanes M and N represent the 100 bp DNA ladder and no template control, respectively. Arrows indicate the sizes of the PCR products, and arrowheads indicate the sizes of different molecular weight bands of the DNA ladder.

