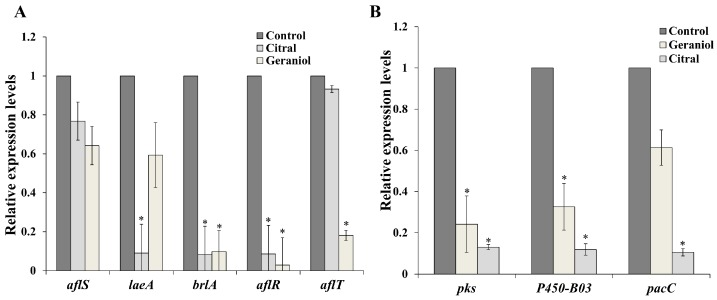
Figure 5.
Relative mRNA expression of growth- and secondary metabolism-related genes of Aspergillus spp. after treatment with geraniol and citral, by qRT-PCR. (A) Expression analysis of growth and aflatoxin biosynthetic genes in A. flavus; (B) Expression analysis of growth and ochratoxin biosynthetic genes in A. ochraceus. Values represent fold changes on the basis of the control (set as 1). Columns with an asterisk (p < 0.05) at the same gene were considered differentially expressed if the corresponding fold change was ≥2 or ≤0.5.

