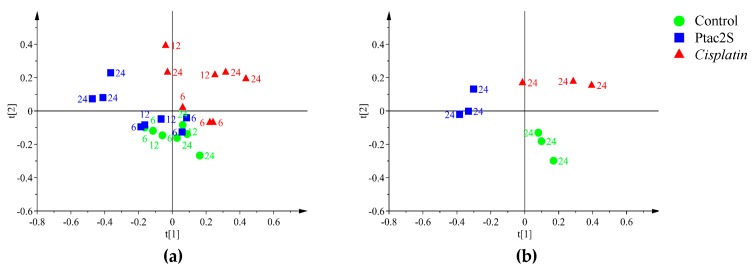
Figure 7.
PCA score scatter plots of the 600 MHz 1H-ZG-NMR spectra (Pareto scaled) obtained from lipophilic extracts of Ptac2S and cisplatin treated SKOV-3 cells in comparison with the untreated control samples. The indicated labels are referred to the culture times. (a) PCA t[1]/t[2] (four components give R2X = 0.905, Q2 = 0.82). (b) PCA t[1]/t[2] (two components give R2X = 0.854, Q2 = 0.771).

