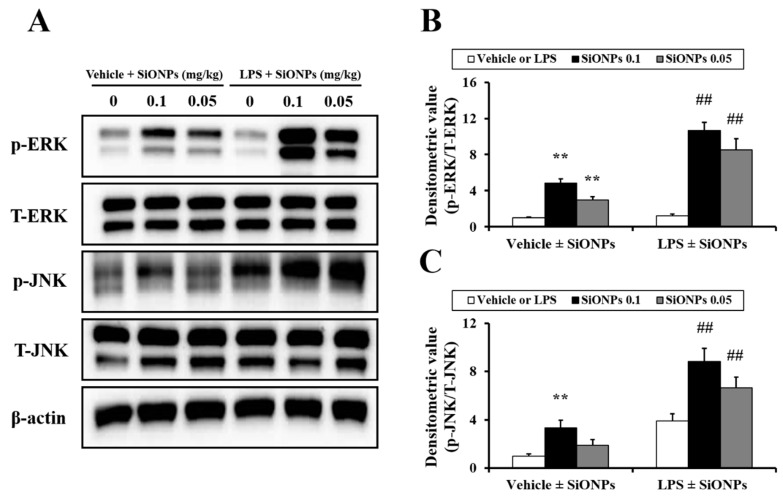
Figure 5.
Effect of SiONPs exposure on ERK and JNK phosphorylation in lung tissues of each group. (A) ERK and JNK expression on gels. (B) Densitometric value of ERK phosphorylation. (C) Densitometric value of JNK phosphorylation. Data represent the means ± SD (n = 5 per group). ** p < 0.01 vs. vehicle control. ## p < 0.01 vs. LPS.

