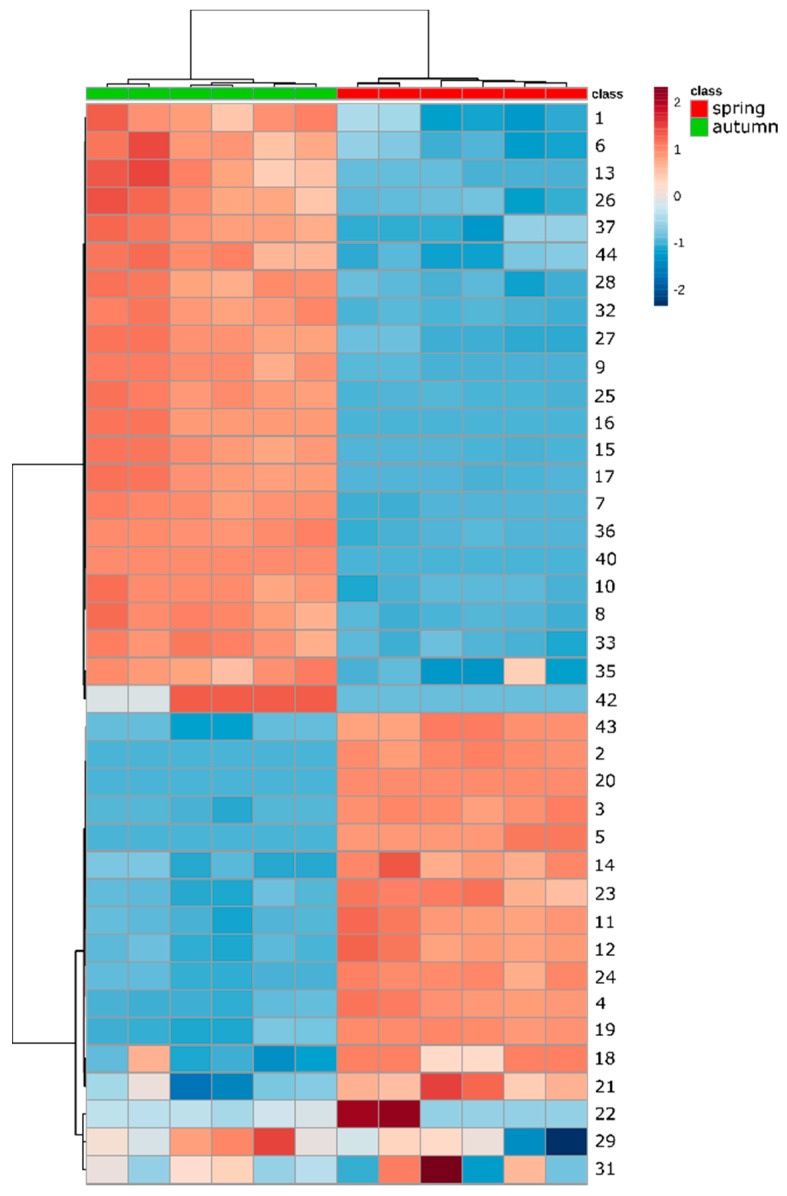
Figure 9.
Result of the aggregative hierarchical clustering (Euclidian distance measure, Ward′s clustering algorithm) of Pulmonaria officinalis samples and metabolites, shown as a heatmap. Numbers correspond to compounds isolated in this study as shown in Figure 1 and Table 1, heatmap colors represent the relative concentrations in the samples from high (red) to low (blue).

