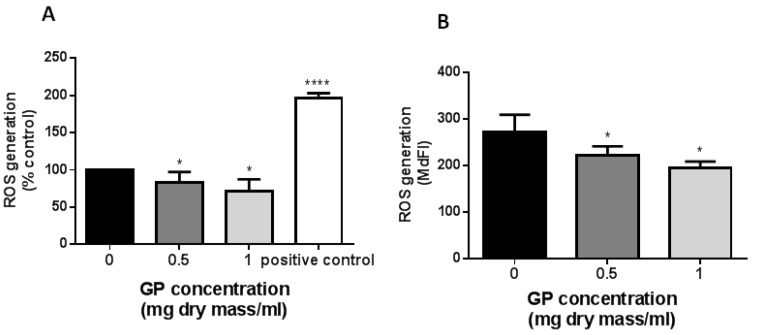
Figure 5.
Effect of G. parviflora extract (GP) on endothelial ROS production. HUVECs EA.hy926 line were treated with GP extract or vehicle control for 24 h. (A) ROS generation were measured after H2DCFDA labeling. The data were derived from three independent experiments and are expressed as a percentage of control. The positive control is hydrogen peroxide (100 µM). Asterisks represent a significant difference compared to the control cells. (B) ROS generation was measured by flow cytometry after labeling with DHR. The data were derived from five independent experiments and are expressed as mean ± SD. Asterisks represent a significant difference when compared to control cells (* p < 0.5, **** p < 0.0001).

