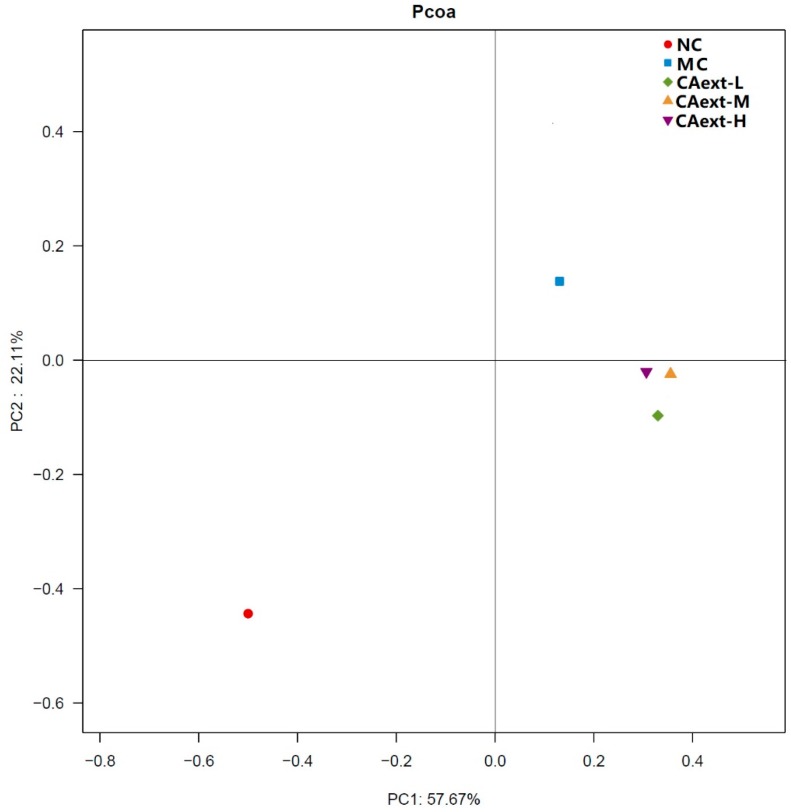
Figure 1.
Principal coordinate analysis (PCoA) plots based on the OTU abundance of gut microbiota of each mouse. The closer the spatial distribution between spots, the greater the bacterial similarity among different groups. NC, normal control, mice were fed with a normal chow and intragastrically administered 20 mL/kg saline; MC, model control, mice were fed with a high-fat feed and intragastrically administered 20 mL/kg saline; CAext-L, CAext-M, CAext-H mice were fed with a high-fat feed and intragastrically administered 10 mg/(kg·d), 15 mg/(kg·d), and 20 mg/(kg·d) Canarium album extract (CAext), respectively.

