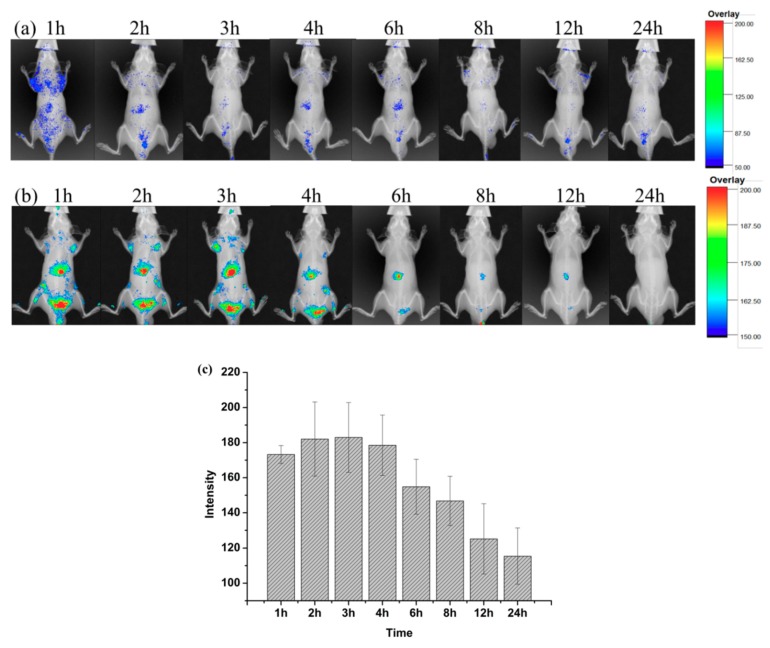
Figure 5.
The fluorescent image in vivo and vitro (a), (b) free 1, 1′-dioctadecyl-3,3,3′,3′-tetramethylindocarbocyanine iodide (DiR)-solution and DiR-liposome in vivo NIR fluorescence imaging at the designated times post injection, (c) The fluorescent intensity at different time points corresponding with (b), (Values represent mean ± SD of 3 animals.).

