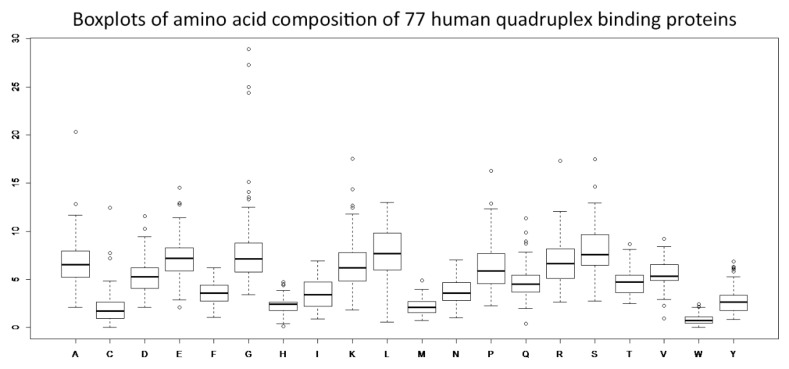
Figure 1.
Boxplots of amino acid compositions of 77 quadruplex binding proteins. Thick horizontal lines within boxplots denote mean amino acid composition values. Data within boxes span the interquartile range and whiskers show the lowest and highest values within 1.5 interquartile range. Empty circles denote outliers.

