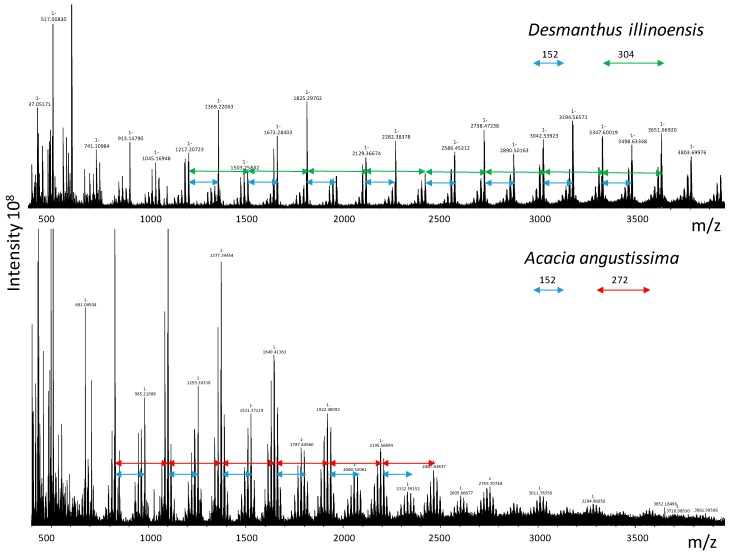
Figure 2.
Representative ultrahigh resolution negative mode MALDI-MS data for CT. The top spectrum was obtained with CT from Desmanthus illinoensis and the bottom spectrum with CT from Acacia angustissima. The mass intervals between the clusters of peaks represent the characteristic subunits for the CT, with an interval of 304 typical of (epi)gallocatechin, an interval of 272 typical of fisetinidol, and an interval of 152 typical of gallate ester modification.

