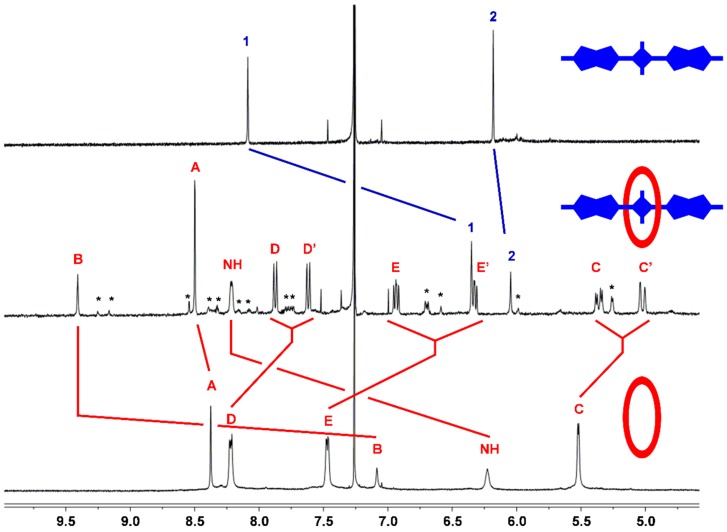
Figure 2.
Comparison of partial 1H-NMR spectra for separate samples of free S3, M1 ⊃ S3, and free M1 in CDCl3. Atom labels are provided in Scheme 2. Red and blue lines indicate major changes in chemical shifts upon complexation. * designates NMR signals for the minor M1 ⊃ S3 complex with encapsulated S3 in a cis conformation (trans/cis ratio for encapsulated S3 is >10:1). See Scheme 2 for atom labels which are numbers (for S3) and letters (for M1).

