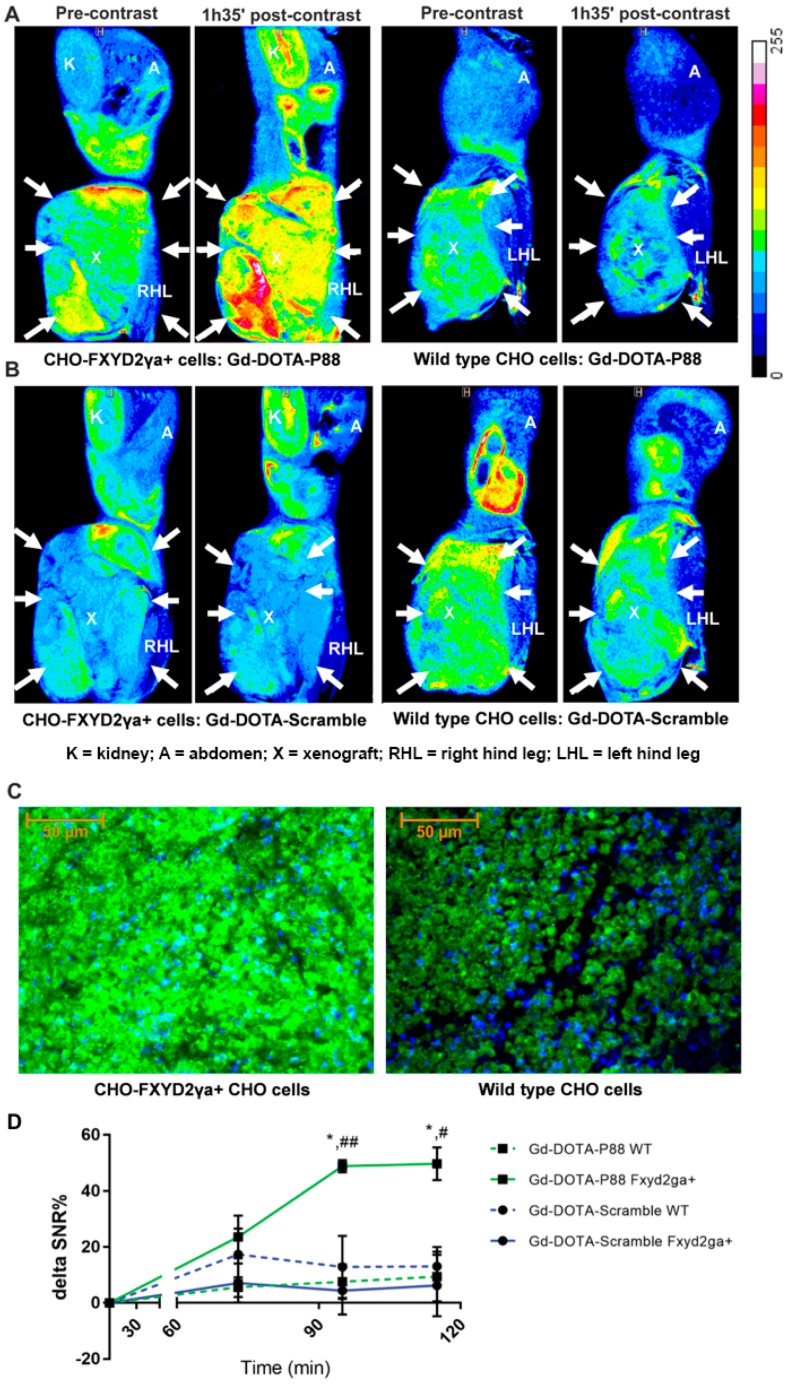
Figure 2.
MR imaging of Gd-DOTA-P88 and Gd-DOTA-Scramble in mice implanted with CHO-FXYD2γa+ and wildtype CHO cells. (A,B) Representative color overlay of MR images of mice bearing CHO FXYD2γa+ or wildtype CHO xenografts. Pre-contrast images were acquired before the injection of CAs while the post-contrast images were obtained 95 min after i.v. administration of 0.1 mmoL Gd/kg b.w. of Gd-DOTA-P88 (A) or Gd-DOTA-Scramble (B). Mice were implanted with CHO-FXYD2γa+ in the right hind leg and with wildtype CHO cells in the left hind leg (xenografts are indicated by arrows). The images are representative for images obtained in 3–4 mice. (C) The FXYD2γa expression in CHO-FXYD2γa+ and wildtype CHO xenografts was confirmed by immunofluorescence, where the biomarker is stained in green with fluorescein and the nuclei are stained in blue with DAPI. (D) Region of Interest (ROI) quantification of the xenografts on the acquired images. The contrast enhancement is expressed as ΔSNR%, Gd-DOTA-P88 is shown in green and Gd-DOTA-Scramble in blue; a solid line indicates CHO-FXYD2γa+ while the dashed line indicates wildtype (wt) CHO cells. The data are expressed as means ± SD, n = 3–4 mice in each group; * p ≤ 0.05: Gd-DOTA-P88-FXYD2γa+ vs. Gd-DOTA-P88-wt; # p ≤ 0.05, ## p ≤ 0.01: Gd-DOTA-P88-FXYD2γa+ vs. Gd-DOTA-Scramble-FXYD2γa+; Two-way ANOVA with Šídák correction for multiple tests. Legend: K = kidney; A = abdomen; X = xenograft; RHL = right hind leg; LHL = left hind leg.

