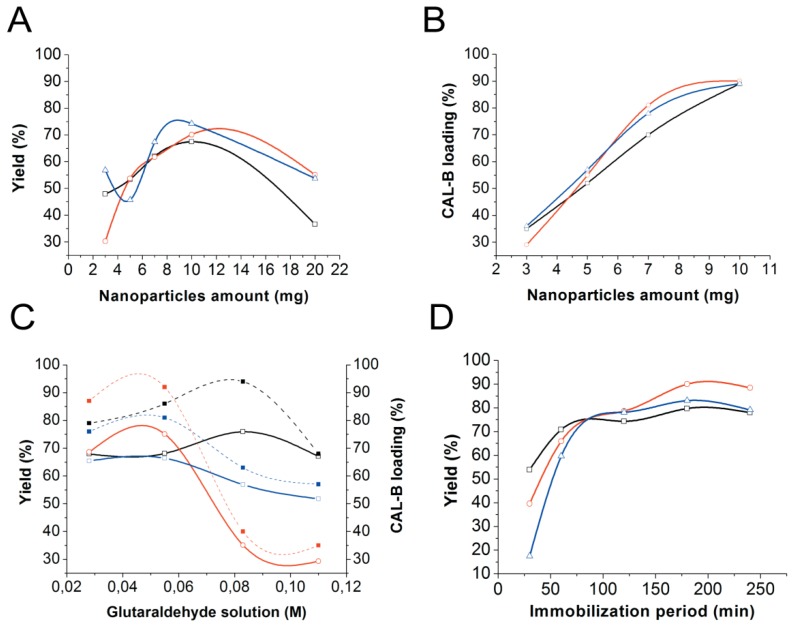
Figure 2.
Analysis of the parameters evaluated in the immobilization protocol. (A) Effect of the amount of nanoparticles used; (B) Load of immobilized CAL-B on the amount of magnetic nanoparticles used; (C) Effect of the glutaraldehyde concentration used in the reaction yield (left axis) and in CAL-B loading (right axis- dotted lines) and (D) effect of the immobilization time. NP-ImS4/CAL-B (black line, □), NP-ImS10/CAL-B (red line, ○) and NP-ImS18/CAL-B (blue line, △).

