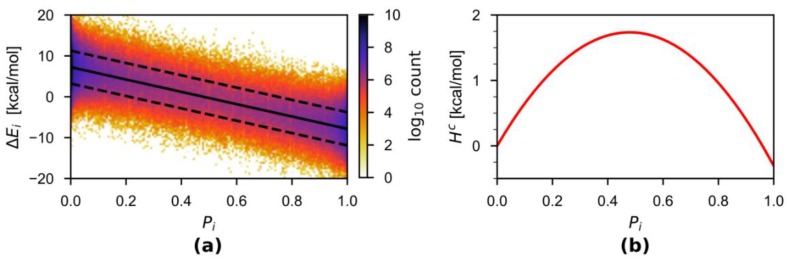
Figure 2.
(a) Density plot of computed from the combined 50-ps simulations. The solid and dashed black lines indicated the and the associated standard deviation, respectively. Linear regression yielded an analytical representation for kcal·mol−1 with R2 = 0.9997. The average standard deviation over the 100 bins is 4.045 kcal·mol−1. (b) The energy correction term computed by integration using the analytical representation of .

