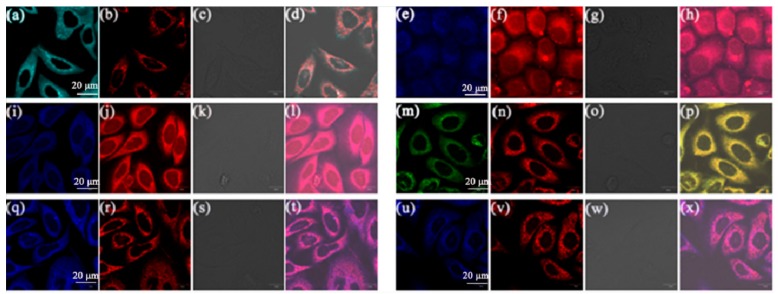
Figure 9.
Co-localized images of A549 cells incubated with (a) 5a, (e) 5b, (i) 5c, (m) 5d, (q) 5e and (u) 5f (10 μM) for 30 min and Mito Tracker Red (200 nM) (b) 5a, (f) 5b, (j) 5c, (n) 5d, (r) 5e, (v) 5f for 15 min with excitation at 405 nm; The bright-field image of A549 cells stained with (c) 5a, (g) 5b, (k) 5c, (o) 5d, (s) 5e, (w) 5f. The merged image stained with (d) 5a, (h) 5b, (l) 5c, (p) 5d, (t) 5e, (x) 5f. Scale bar: 20 μm.

