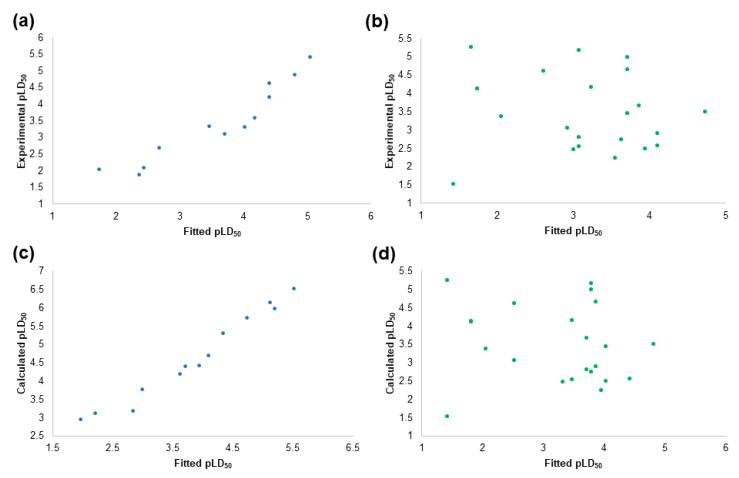
Figure 7.
The plot of experimental vs. fitted pLD50 values calculated with QSAR model 5 for training set pesticides (a); test set pesticides (b) against Mus musculus. The plot of calculated vs. fitted pLD50 values calculated with QSAR model 5 for training set pesticides (c); test set pesticides (d) against Homo sapiens.

