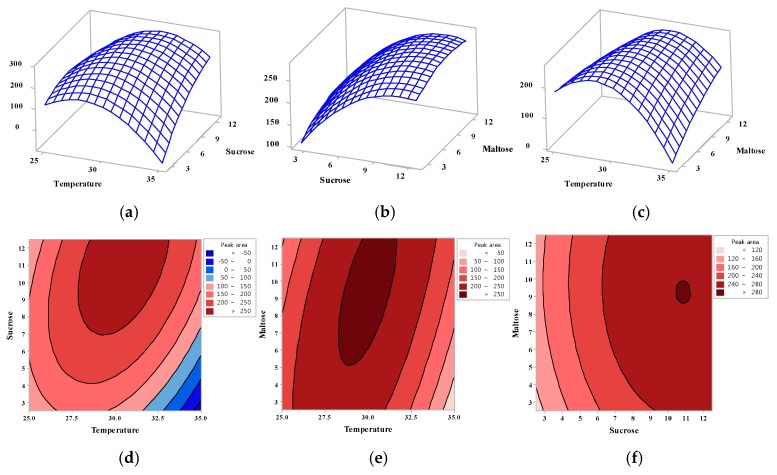
Figure 2.
Three-dimensional response surface plots (a–c) and contour plots (d–f) showing the optimization of oligosaccharide production by assessing the interactions between temperature, sucrose concentration, and maltose concentration. (a) Response surface plot showing the effect of temperature (X1) and sucrose concentration (X2) on oligosaccharide production (b) Response surface plot showing the effect of temperature (X1) and maltose concentration (X3) on oligosaccharide production (c) Response surface plot showing the effect of sucrose concentration (X2) and maltose concentration (X3) on oligosaccharide production (d) Contour plot showing the effect of temperature (X1) and sucrose concentration (X2) on oligosaccharide production (e) Contour plot showing the effect of temperature (X1) and maltose concentration (X3) on oligosaccharide production (f) Contour plot showing the effect of sucrose concentration (X2) and maltose concentration (X3) on oligosaccharide production.

