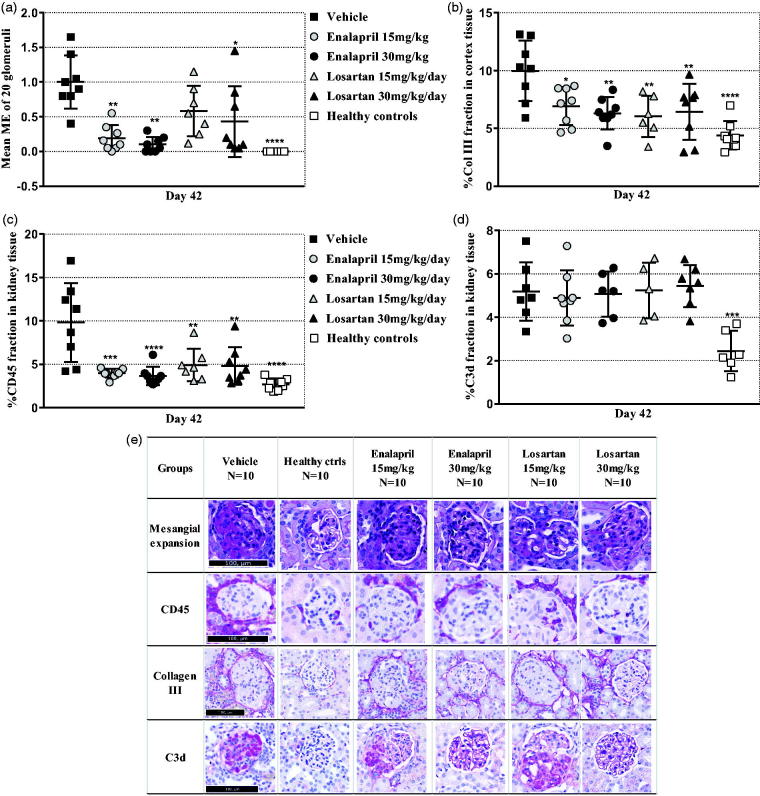
Figure 5.
Effect of inhibitors of the renin-angiotensin system on histopathology. (A) Scatter plot is showing the mean glomerular mesangial expansion (ME) score. (B) Scatter plot is showing semi-quantification of collagen III positive area of the cortex area. (C) Scatter plot is showing semi-quantification of the CD45 positive area of the cortex area. (D) Scatter plot is showing semi-quantification of the C3d positive area of the cortex area. (E) Representative histopathological images. Data are shown as mean ± SD. *p < .05, **p < .01, ***p < .001, ****p < .0001 groups vs. vehicle group by one-way ANOVA using Tukey’s multiple comparisons test or Kruskal–Wallis multiple testing (n = 10).

