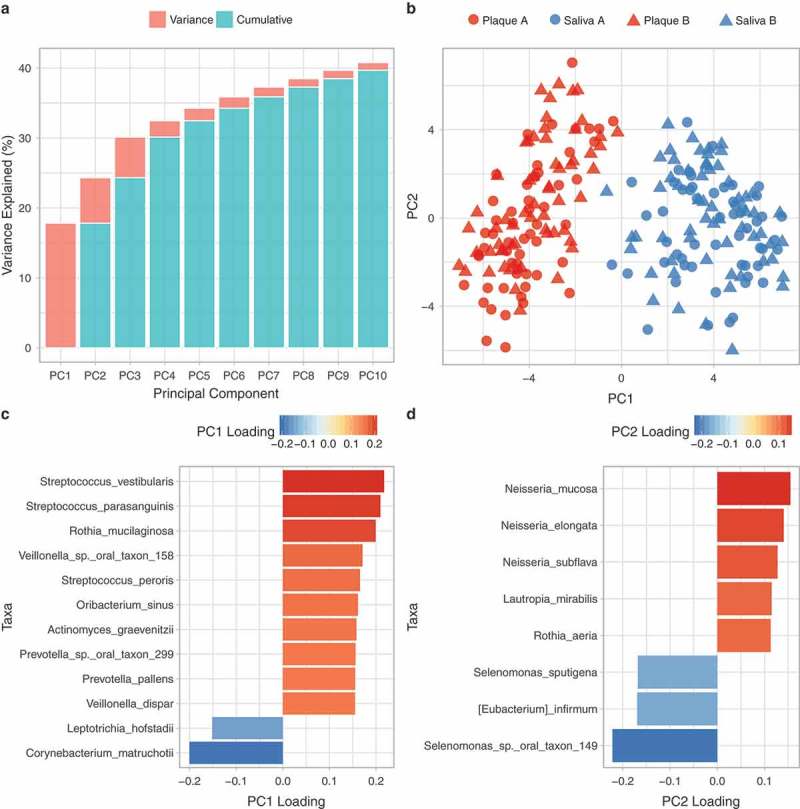
Figure 3.

PCA of the microbial profiles of the 230 saliva and plaque samples, at the species level. (a) Individual and cumulative variance explained by the first 10 principal components. (b) Bacterial communities based on PC1 and PC2, (c) Loadings onto PC1, (d) Loadings onto PC2.
