Figure A1.

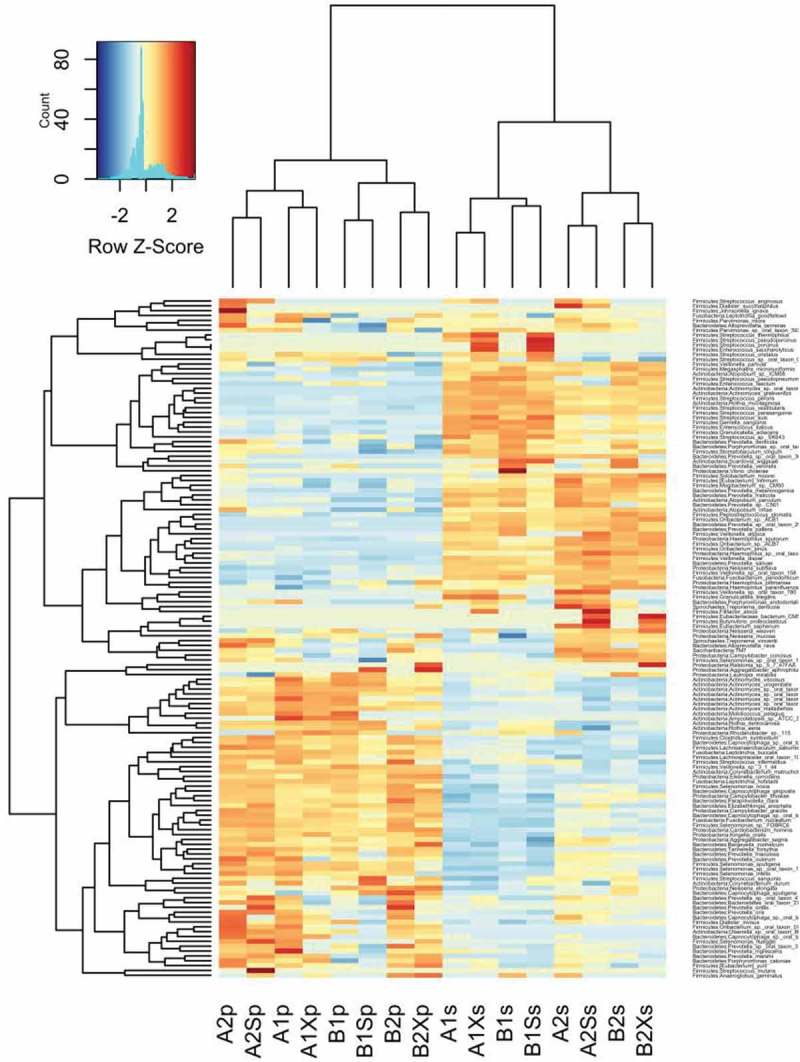
Heatmap of 16S rRNA gene abundance in samples collected from Groups A and B at each time point ordered by sample clustering horizontally and taxonomic classification vertically.

Heatmap of 16S rRNA gene abundance in samples collected from Groups A and B at each time point ordered by sample clustering horizontally and taxonomic classification vertically.