
Figure A4.
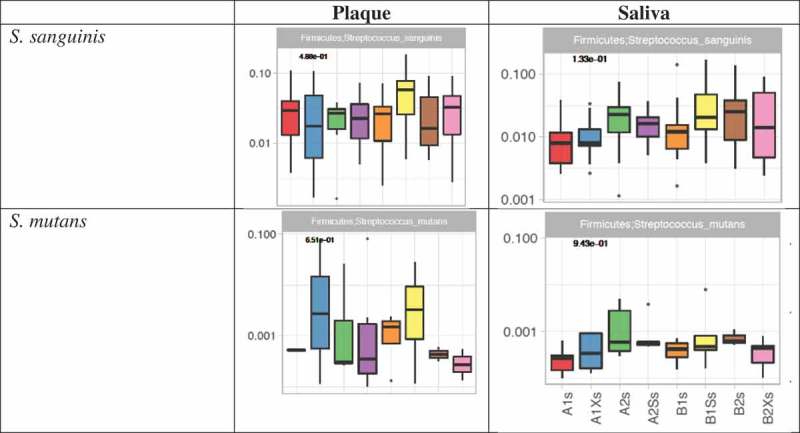
Analysis of variance of S. sanguinis and S. mutans in saliva and plaque.
The y-axis shows relative abundance. p values from Kruskal–Wallis tests are shown in bold at the top left of each chart.
Official websites use .gov
A
.gov website belongs to an official
government organization in the United States.
Secure .gov websites use HTTPS
A lock (
) or https:// means you've safely
connected to the .gov website. Share sensitive
information only on official, secure websites.
Analysis of variance of S. sanguinis and S. mutans in saliva and plaque.
The y-axis shows relative abundance. p values from Kruskal–Wallis tests are shown in bold at the top left of each chart.