
Figure A7.
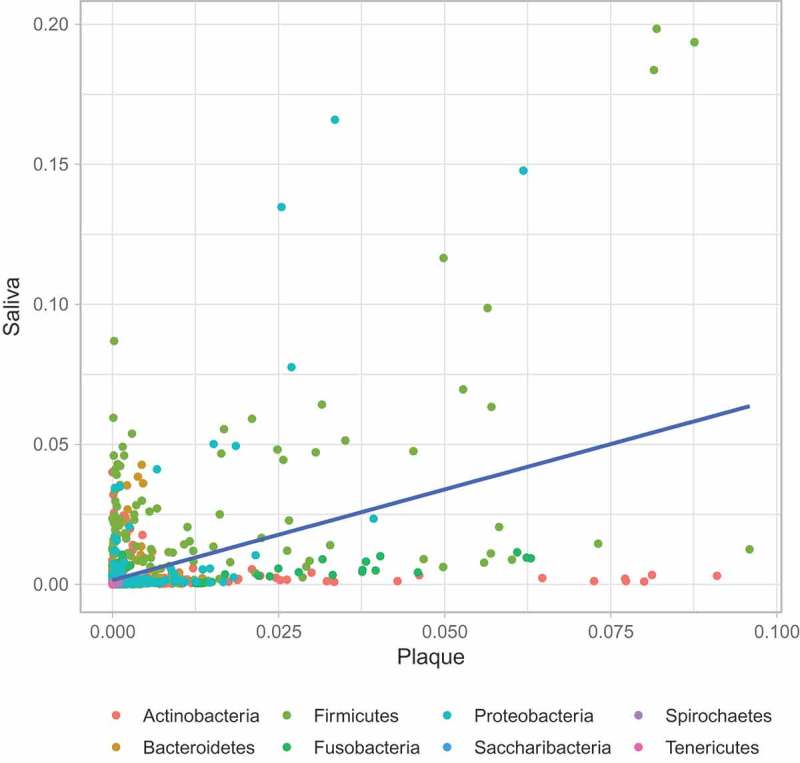
Correlation of microbiome taxa abundance between plaque and saliva samples (across all conditions). Each circle denotes a microbiome genus. The genera are colour-coded according to their phyla. Linear regression is indicated by the blue line with grey shade representing the confidence interval.
KeyRed = A1s Green = A2s Orange = B1s Brown = B2sBlue = A1Xs Purple = A2Ss Yellow = B1Ss Pink = B2Xs