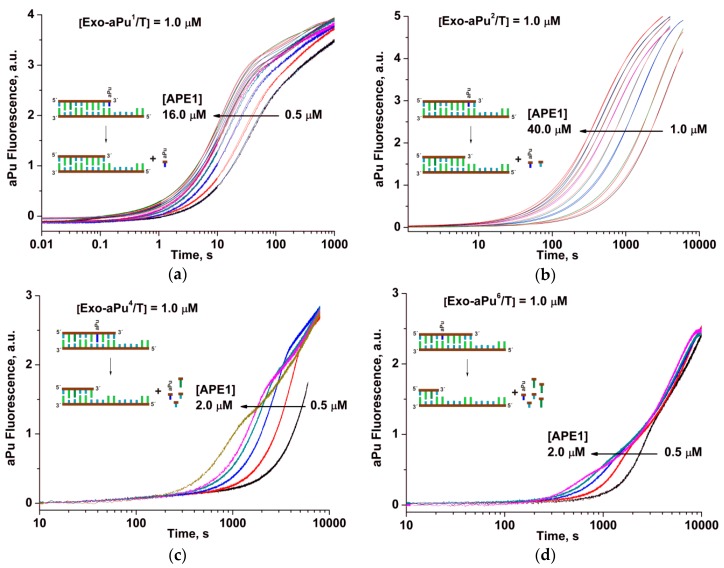
Figure 3.
Changes in aPu fluorescence intensity during the interaction of APE1 with one of the substrates: (a) Exo-aPu1/T, (b) Exo-aPu2/T, (c) Exo-aPu4/T, or (d) Exo-aPu6/T. Concentrations of the enzyme and DNA are indicated in the panels. Kinetic traces for different APE1 concentrations are shown in different colors.

