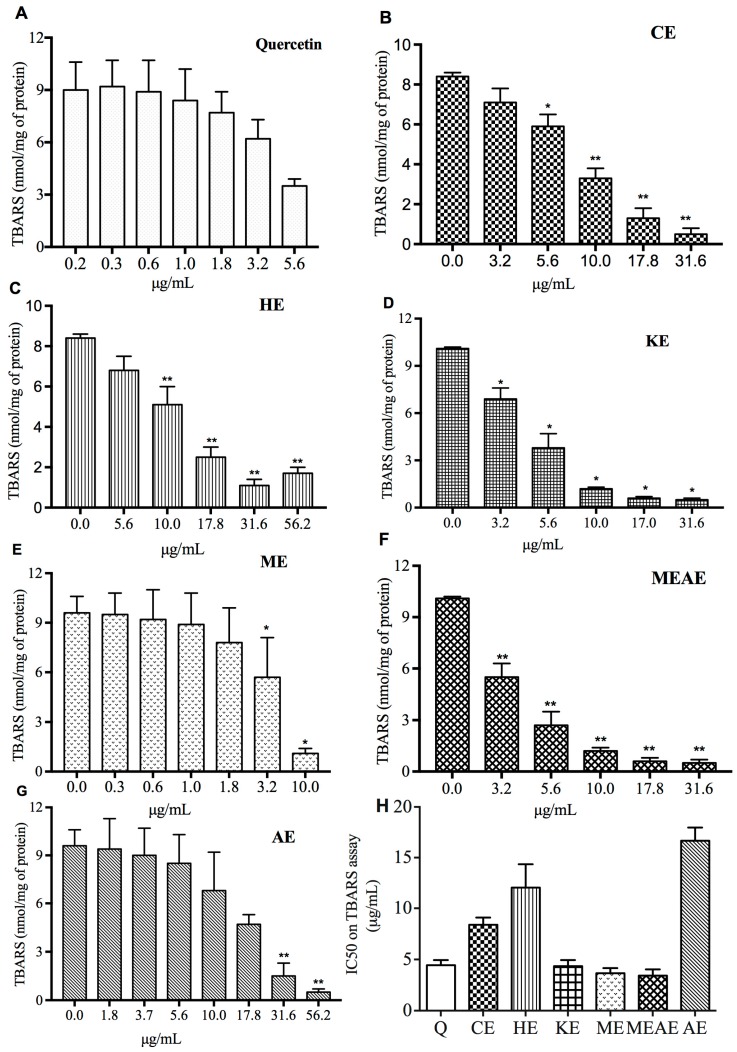
Figure 4.
Inhibition of lipid peroxidation (A–G) and inhibitory concentration 50% (IC50) values (H) of the extracts from AF pods and standard quercetin, quantified by lipid peroxidation (TBARS) production. CE = chloroformic extract; HE = hexanic extract; KE = ketonic extract; ME = methanolic extract; MEAE = methanolic:aqueous extract and AE = aqueous extract. Q = quercetin. The data are the mean with the standard error of three independent repetitions. * p < 0.05 and ** p < 0.01 vs. control group.

