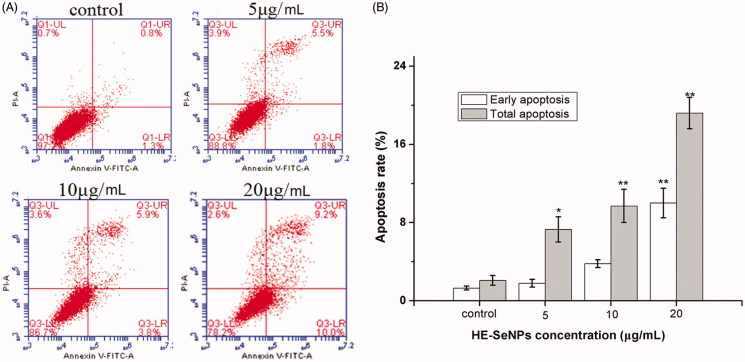
Figure 4.
Flow cytometric analysis of HE-SeNPs-induced HepG2 cells apoptosis. (A) Flow cytometry dot plots of Annexin V-FITC/PI double staining for the detection of cell apoptosis. (B) Flow cytometric analysis results. HepG2 cells were incubated with HE-SeNPs at the concentrations of 0, 5, 10 and 20 μg/mL for 24 h. *p < 0.05 and **p< 0.01 versus the control group.

