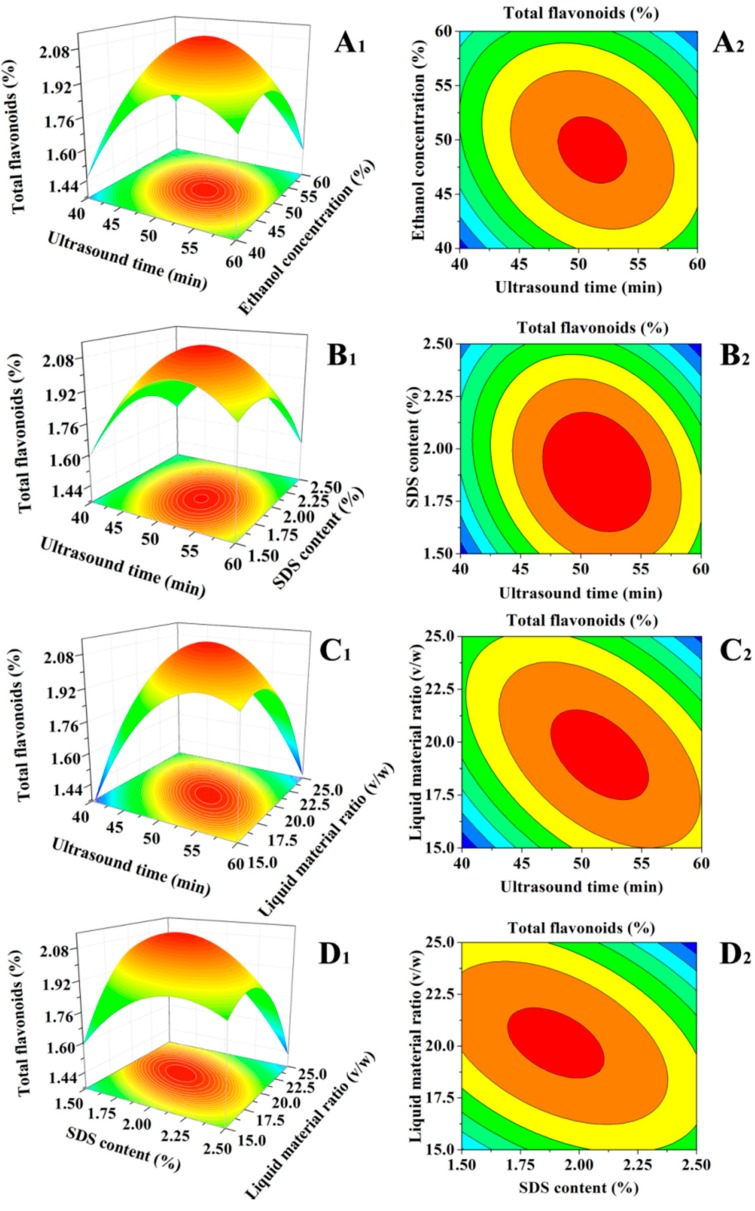
Figure 4.
Response surface for the effect of operating parameters on total flavonoid contents; (A1) ultrasound time vs. ethanol concentration; (B1) ultrasound time vs. an SDS content; (C1) ultrasound time vs. liquid material ratio (v/w); (D1) an SDS content vs. liquid material ratio (v/w). (A2–D2) are their contour plots, respectively.

