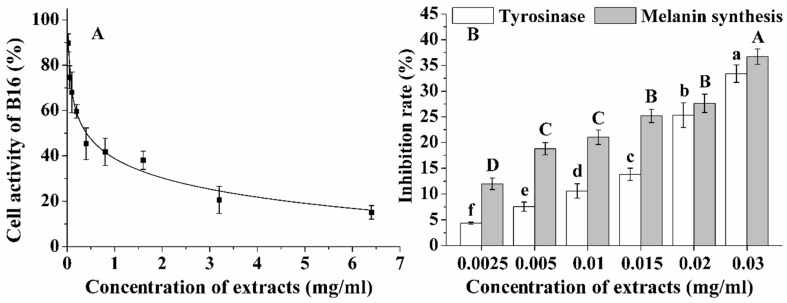
Figure 6.
The cell activity (A) and the inhibition rate of tyrosinase and melanin synthesis (B) in B16 cells. Capital letters indicate differences in the inhibition rate of melanin synthesis under different treatment; lowercase letters indicate differences in the inhibition rate of tyrosinase under different treatment (p < 0.05).

