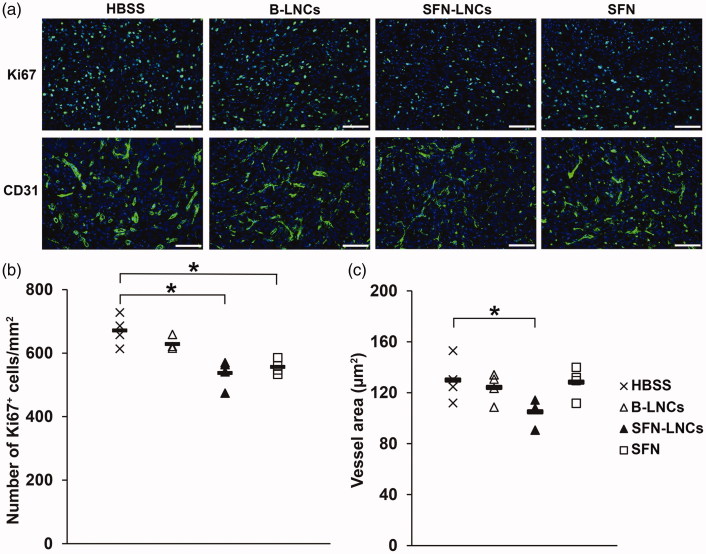
Figure 4.
Effect of SFN-LNCs on Ki67+ cell number and CD31+ vessel area. (a) Immunofluorescence staining for Ki67 and CD31 in the tumor on day 16 in each group of animals (scale bar = 100 μm). (b and c) Quantitative results for Ki67 and CD31 immunofluorescence. Results are expressed as the mean number of Ki67+ cells per mm2 ± SEM (b) or CD31+ vessel area ± SEM (c) (*p < .05 vs. HBSS, one-way ANOVA followed by Dunnett’s post hoc test for multiple comparisons).

