
Figure 1.
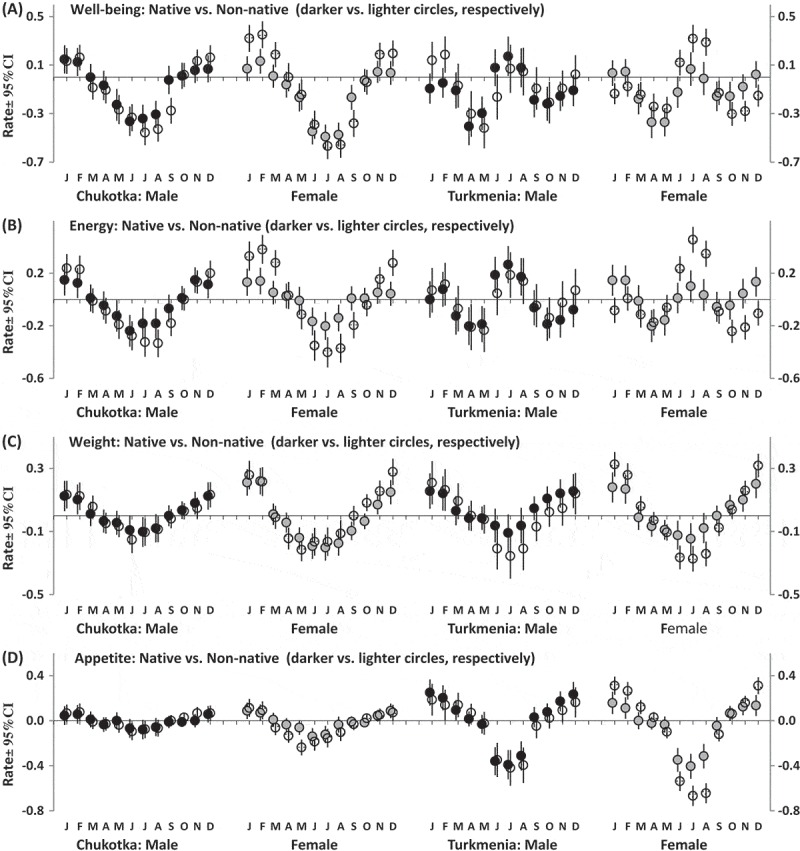
Month-to-month variation in rate of characteristics of well-being and behavior.
Estimated marginal means ± Confidence Interval (CI, vertical lines). The examples of bi- and unimodal seasonality patterns (a and b and c and d, respectively). Difference between retrospective reports of feeling worse and best (a), least and most energetic (b), gain most and lose most weight (c), and eat most and least in a particular month (d).