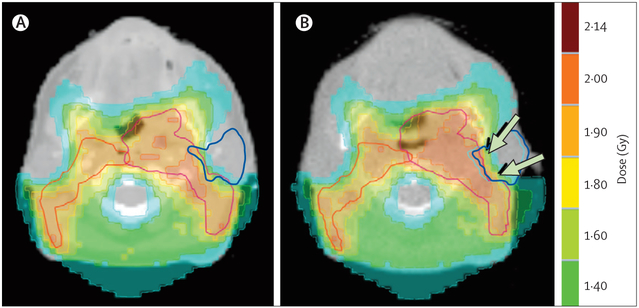
Figure 1: Comparison between the planned isodose distribution and the dose distribution actually delivered on the 25th fraction.
(A) Kilovoltage CT with contrast enhancement and (B) megavoltage CT without contrast enhancement for a patient with a T2-N3 oropharyngeal squamous-cell carcinoma. The patient was treated with chemoradiotherapy. Planned radiotherapy dose was 50·0 Gy administered as 25 fractions of 2·0 Gy, and planning target volumes are delineated in red. The left parotid gland is delineated in blue. Arrows indicate the overdose of the left parotid gland compared with the planned dose.

