Figure 4:
HEOs contain progenitors that give rise to differentiated stratified squamous epithelium.
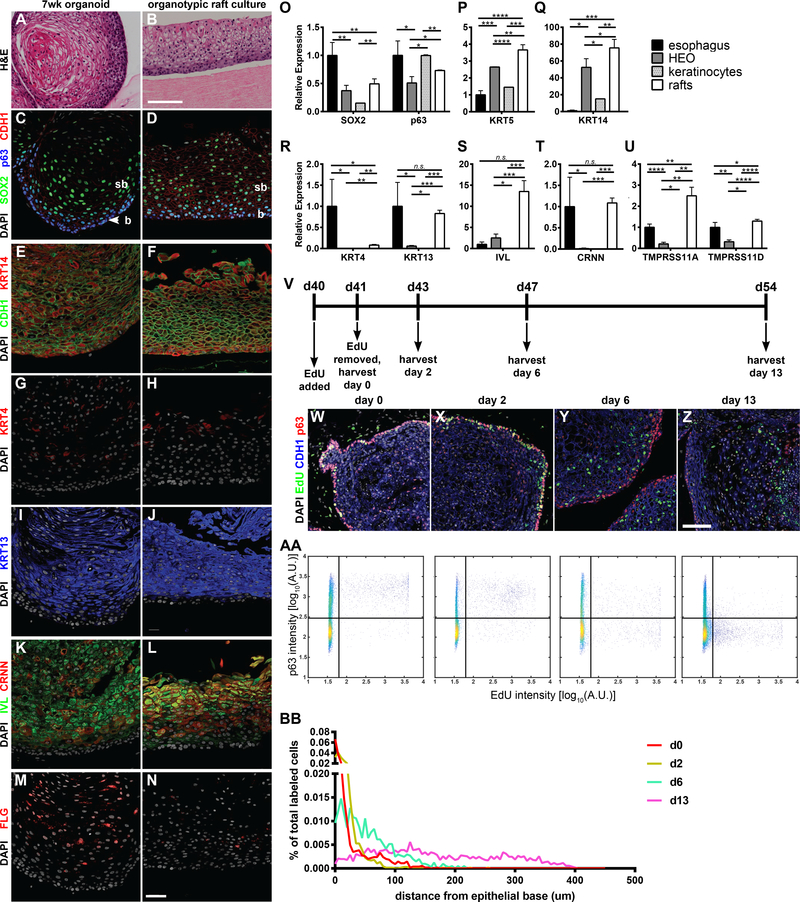
(A-B) H&E staining comparing 7 week HEOs to organotypic rafts generated using HEO-derived from keratinocytes. (C-N) Comparison of 7 week HEOs to organotypic rafts by IF analysis of transcription factors SOX2 and p63 (C-D), basal marker KRT14 (E-F), suprabasal keratins KRT4 (G-H) and KRT13 (IJ), and differentiated markers IVL, CRNN, and FLG (K-N). (O-U) qPCR analysis of esophageal biopsies, 7 week HEOs, HEO-derived keratinocytes, and organotypic rafts for SOX2 and TP63 (O), KRT5 (P), KRT14 (Q), KRT4 and KRT13 (R), IVL (S), CRNN (T), and esophageal specific markers TMPRSS11A/D (U). (V) Protocol for EdU pulse-chase labeling experiment in HEOs. (W-Z) IF images of HEOs at various time-points post-labeling. (AA-BB) Analysis of IF images using a 2D histogram of P63 intensity versus EdU intensity. (AA) and a 1D histogram of percent of total EdU labeled cells versus distance from the epithelial base (BB). b = basal; sb = suprabasal. Scale bar = 50μm (C-N), 100μm (A-B,S-V). See quantification and statistical analysis section for details. See also Figure S5.

