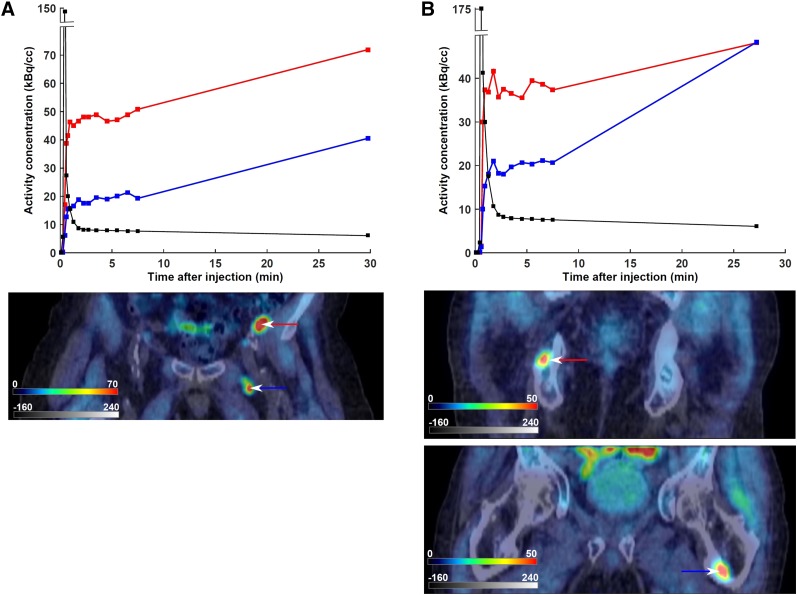
FIGURE 2.
Relationship between SUV and 11C-choline pharmacokinetics in 2 patients with biopsy-proven disease recurrence. Late static PET scans, fused with their corresponding CT scans, are included. Input function time–activity curves are superimposed in black. Color scales are kBq/cm3 and Hounsfield units for PET and CT, respectively. (A) Patient 1, exhibiting concordance between SUV and kinetic rate constants. First lymph node, marked with red time–activity curve and arrow (SUV = 10.7, K1 = 1.64 min−1, K1/k2 = 4.91, k3 = 0.21 min−1), exhibits both higher SUV and higher K1 and K1/k2 than second lymph node, marked with blue time–activity curve and arrow (SUV = 6.0, K1 = 0.59 min−1, K1/k2 = 1.16, k3 = 0.70 min−1). (B) Patient 2, exhibiting discordance between SUV and kinetic rate constants. The osseous metastasis marked with red time–activity curve and arrow (SUV = 5.0, K1 = 0.97 min−1, K1/k2 = 4.17, k3 = 0.18 min−1) has similar SUV but different pharmacokinetics from the osseous metastasis marked with blue time–activity curve and arrow (SUV = 5.0, K1 = 0.41 min−1, K1/k2 = 1.27, k3 = 1.00 min−1).

