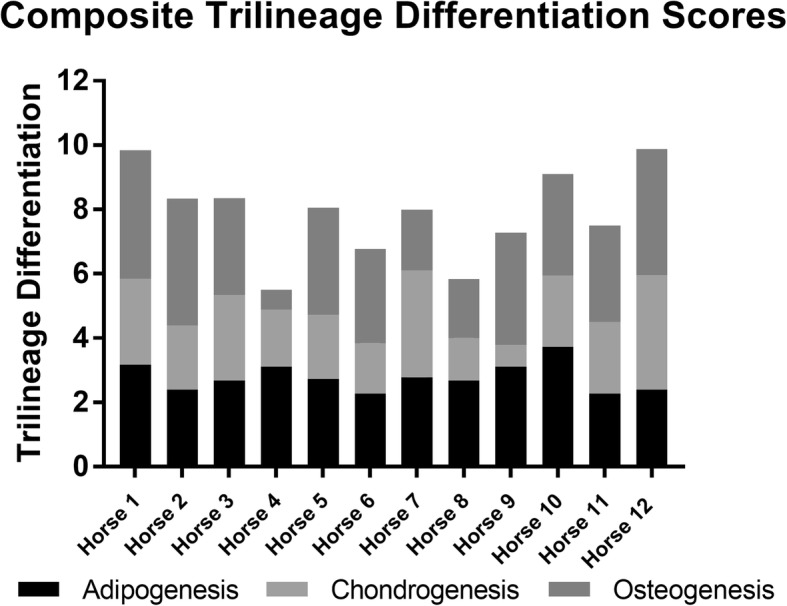
Fig. 2.

Stacked trilineage differentiation (TLD) scores showing MSC differentiation from each donor in the AUTO and FBS groups. The black portion of the bar represents adipogenesis, light gray represents chondrogenesis, and dark gray represents osteogenesis. Each cell lineage was weighted equally with a maximum score of 4. Horses 1–6 (AUTO)received autologous cell depleted of FBS and were donors for horses in the ALLO group. Horses 7–12 (FBS) received autologous cells contaminated with intracellular xenogen. There were no significant differences between the groups
