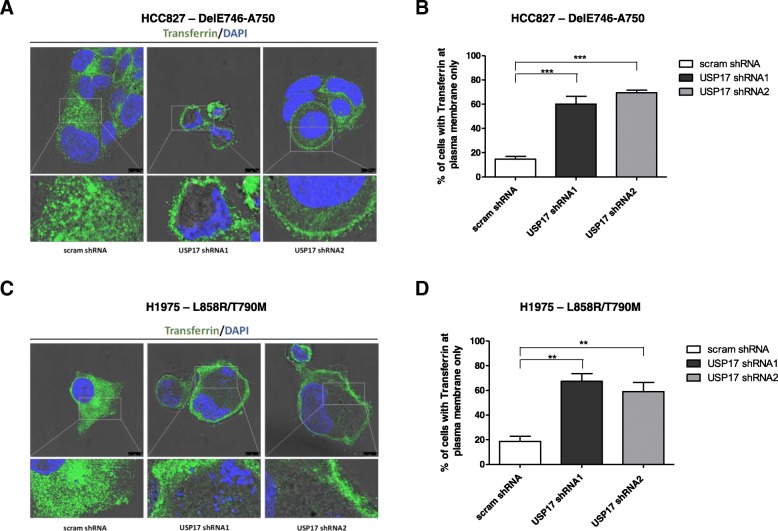
Fig. 3.
(a) HCC827 cells were transfected as indicated and 72 h post transfection the cells were starved in serum free media for 30 mins prior to incubation with 25 μg/mL transferrin (Sigma). After 15 min the cells were fixed and stained using an anti-transferrin antibody (green) and transferrin localisation was assessed in brightfield and fluorescent images taken using confocal microscopy. Bottom panels are enlarged images of the indicated area in the upper panels. Scale bar = 10 μm. (b) At least 50 cells per condition were blindly scored for three separate experiments based on the plasma membrane localisation of transferrin receptor. (c) H1975 cells were transfected as indicated and 72 h post transfection the cells were starved in serum free media for 30 mins prior to incubation with 25 μg/mL transferrin (Sigma). After 15 min the cells were fixed and stained using an anti-transferrin antibody (green) and transferrin localisation was assessed in brightfield and fluorescent images taken using confocal microscopy. Bottom panels are enlarged images of the indicated area in the upper panels. Scale bar = 10 μm. (d) At least 50 cells per condition were blindly scored for three separate experiments based on the plasma membrane localisation of transferrin receptor. ** p < 0.01, *** p < 0.001

