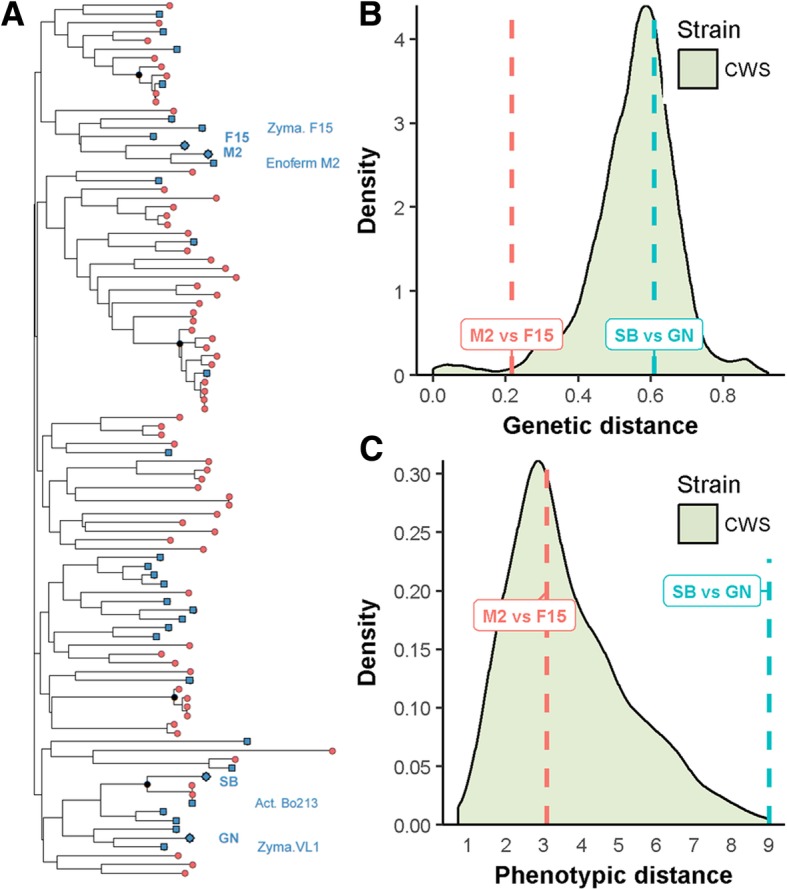
Fig. 2.

Genetic distance between parental strains. Panel a Genetic relationships between 96 commercial wine yeast strains and the four parental monosporic clones GN, M2, F15 and SB used in this work (diamonds). The dendrogram tree was built using Bruvo’s distance and Neighbor-Joining’s clustering strains from the inheritance of 15 polymorphic microsatellites described by Legras et al. [55]. Black dots represents nodes encompassing group of strains highly similar (bootstrap values > 85). Among the strains genotyped, 31 (CWS) have been previously phenotyped and covered all the branches of the tree (blue squares). Panel b The distribution of Bruvo’s distance for all genotyped strains. The relative distances between SB vs GN and M2 vs F15 are 0.61 and 0.22, respectively. Panel c The distribution of the phenotypic distance computed for 35 strains (31 CWS and the four parental strains). The data used eight traits in five grape musts and were obtained from [56]. Dashed lines shows the relative distance between parental pairs SB vs GN and M2 vs F15
