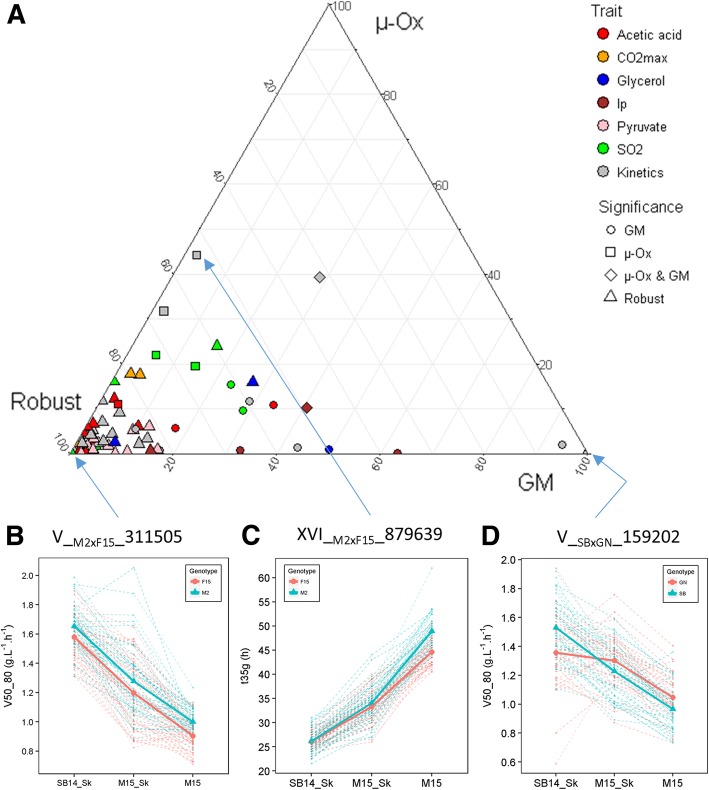
Fig. 7.
Interaction level of QTLs and environmental conditions. Panel a. The ternary plot shows the proportion between genetic effect (G), interaction with grape must (GM) and interaction with micro-oxygenation (μ-Ox) for each QTL. Significance levels were assessed by ANOVA (α = 0.05). Panel b. Three examples of QTLs for which extreme levels of interaction were identified (i.e. the less interacting QTL, the most interacting QTL with micro-oxygenation and the most interacting QTL with grape must). Dashed lines show the reaction norm of each segregant according to their allele inheritance. Full lines show average value of the all the segregant according to marker inheritance

