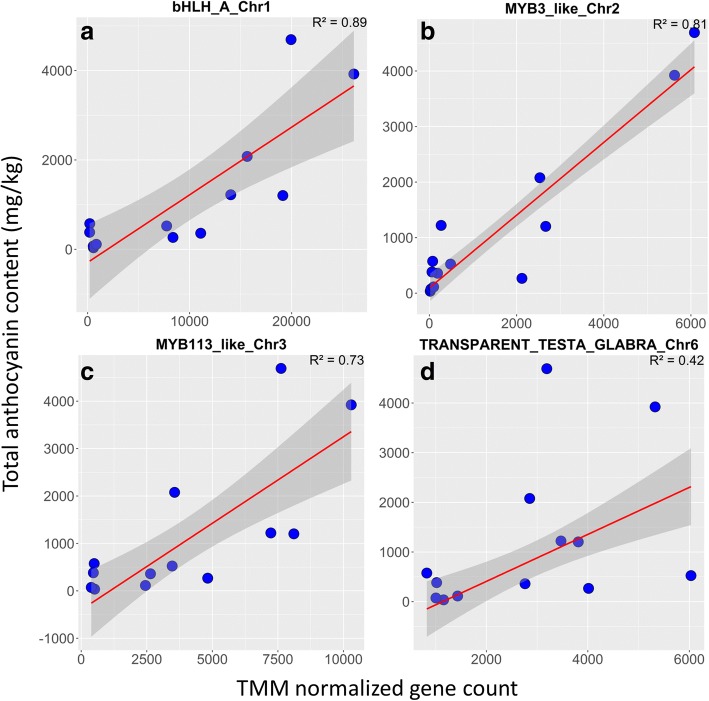
Fig. 4.
Correlation between the transcriptome abundance and total anthocyanin content for genes differentially expressed in a purple color-specific manner. The red-lines and grey-area represent estimated fit-line and 95% confidence region, respectively. The correlations are showed for: a bHLH-A (LOC108204485), b MYB3-like (LOC108208100), c MYB113-like (LOC108213488), d TRANSPARENT TESTA GLABRA 1 (LOC108224236).

