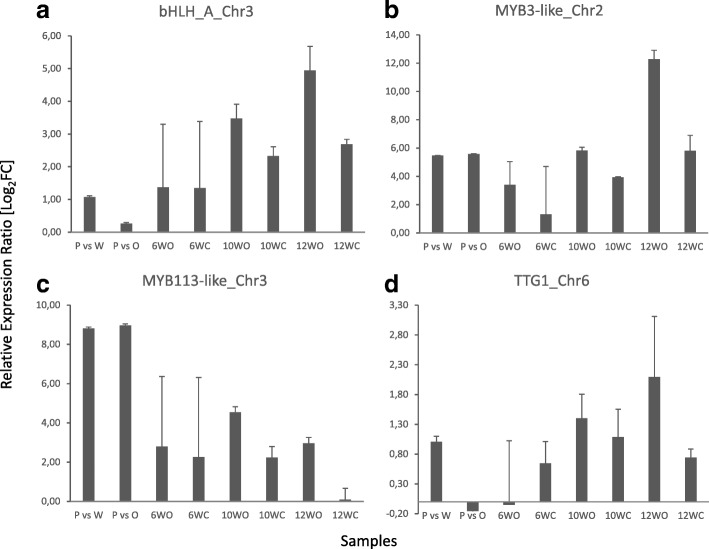
Fig. 5.
Validation of differentially regulated genes associated with the anthocyanin content by qRT-PCR. Data were normalized to the expression of glyceraldehylde 3-phosphate dehydrogenase (G3PDH) for each sample. P vs W indicates the comparison between purple and white calli, and P vs O indicates the comparison between purple and orange calli. 6WO, 10WO and 12WO indicate the comparison between outer and middle tissue for 6-, 10- and 12-week-old taproots, respectively. Similarly, 6WC, 10WC and 12WC indicate the comparison between center and middle section for 6-, 10- and 12-week-old taproots, respectively. The results are showed for the following genes: a bHLH-A (LOC108204485), b MYB3-like (LOC108208100), c MYB113-like (LOC108213488), d TRANSPARENT TESTA GLABRA 1 (LOC108224236).

