Fig. 2.
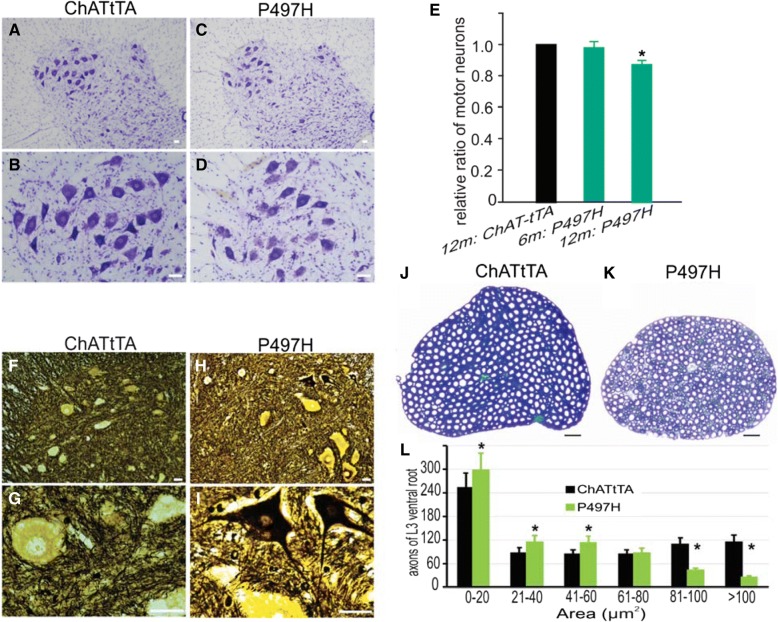
Motor neuron degeneration in ChATtTA/UBQLN2P497H rats. a-d Representative images of cresyl violet staining revealed the motor neurons of the lumbar spinal cord. e A graph showing the relative ratio of the motor neurons of the L3–5 spinal cord counted using ImageJ software. This graph shows that there was a mild loss of motor neurons in ChATtTA/UBQLN2P497H rats (P497H) at 12 months old. The “m” denotes month in this graph. The data are reported as the mean ± standard deviation (n = 4). *p < 0.05. f-i Bielschowsky’s silver staining showed degenerating motor neurons in the ventral horn of spinal cord in ChATtTA/UBQLN2P497H but not in ChATtTA rats. j-k Toluidine staining revealed the L3 ventral roots of spinal cords. l The motor axons of L3 ventral roots were counted with ImageJ software. The data are shown as the mean ± standard deviation (n = 4 rats). Scale bars: 50 μm (a-d), 30 μm (f-k)

