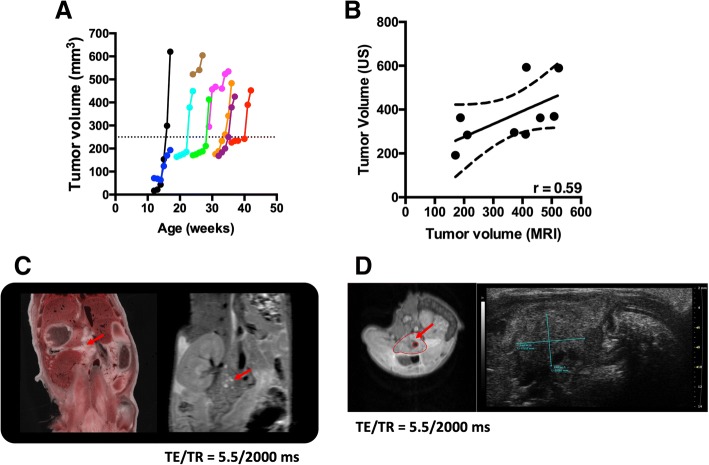
Fig. 1.
a Progressive tumor volumes for individual KPC mice (n = 9) that were imaged longitudinally. There was an exponential increase in tumor volume, in 6 out of 9 animals, once it reached a certain threshold value i.e. 250 mm3 (dotted line) in this study. b Correlation between US and MRI measurements for tumor volume. c Representative whole body image of tumor in KPC mice (Bioinvision, Cleveland, OH) and coronal MR image of the same mouse. d Representative axial MR and US image of tumor in the same KPC mouse. Red arrows point towards pancreatic tumor (c and d)

