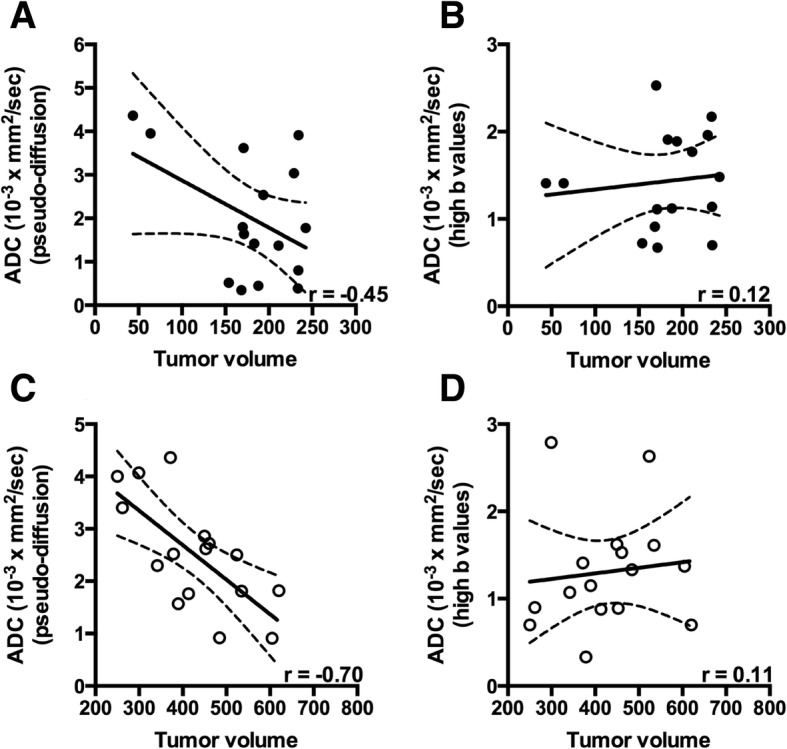
Fig. 3.

Relationship between tumor volume and diffusion measurements. a and b show the relationships between tumor volume and ADC (pseudo-diffusion), and ADC (high-b values), respectively, when the tumor volume is smaller than 250 mm3. c and d show the relationships between tumor volume and ADC (pseudo-diffusion), and ADC (high-b values), respectively, when the tumor volume is larger than 250 mm3
