Fig. 7.
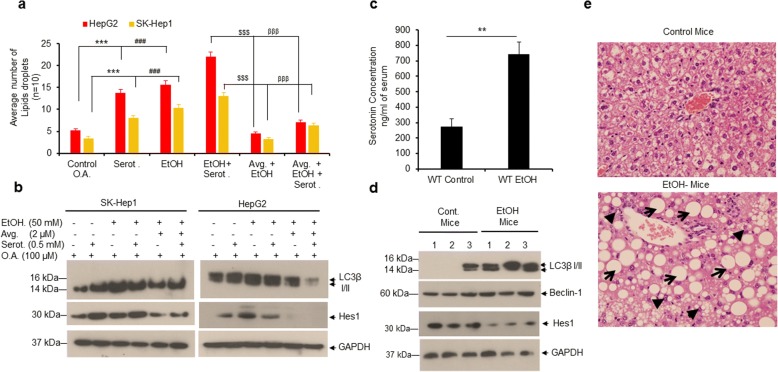
Ethanol induces lipid accumulation in both liver cancer cells and in mice fed with EtOH. a HepG2 and SK-Hep1 cells were grown on coverslips in 6-well plates and treated with serotonin (0.5 mM), EtOH (50 mM), EtOH + serotonin, or in combination with Notch inhibitor AVG (2 μM) + EtOH or AVG + EtOH + Serotonin as indicated for 24 h. Cells were further treated with vehicle alone or 100 μM OA for 24 h and stained with Oil Red O. The number of Oil-Red-O-stained lipid droplets present in steatotic cells (n = 10) were measured and plotted. b HepG2 and SK-Hep1 cells were treated as indicated in section 7a and lysates were immunoblotted with indicated antibodies. c Serotonin concentrations in serum samples of control and EtOH-fed mice (n = 4) were quantified as described in the materials and methods section. d Thirty micrograms of protein extracts from control and EtOH-fed mouse liver tissue were immunoblotted with indicated antibodies. e Representative hematoxylin and eosin (H&E)-stained liver sections of male C57BL/6 J mice pair-fed control diets (upper panel) or chronic EtOH (lower panel) (original magnification 400X). Macrovesicular (indicated by arrows) and microvesicular steatosis (indicated by arrowheads) were observed only in EtOH-fed mouse livers. Data are expressed as the mean ± S.D. **p < 0.01 compared to mice fed with control diet. ***p < 0.001, compared to OA. ###p < 0.001 compared to serot. $$$p < 0.001 compared to EtOH + serot. βββp < 0.001 compared to AVG + EtOH. AVG- avagacestat. EtOH- Ethanol. Serot.- Serotonin. OA- Oleic acid

