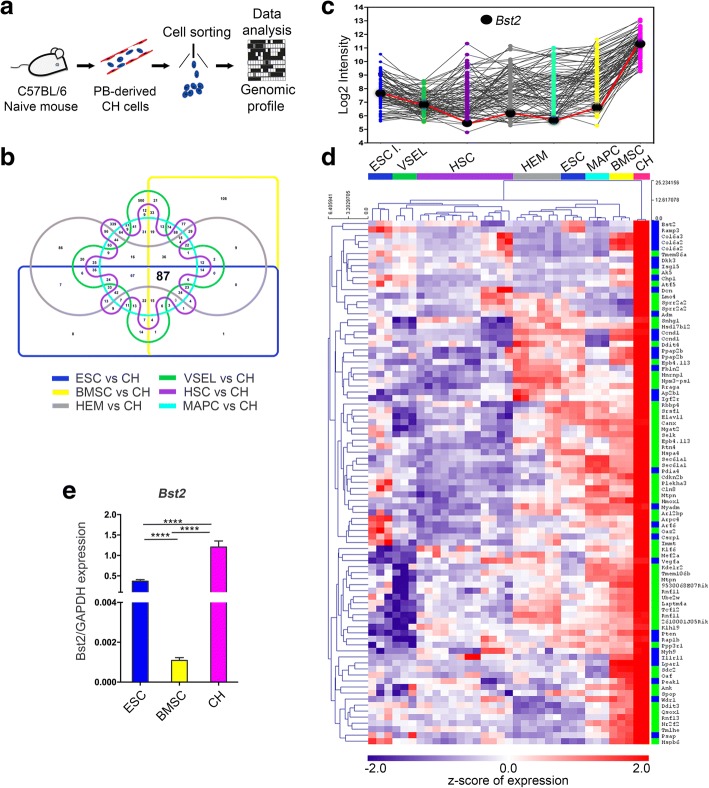
Fig. 1.
Transcriptome analysis reveals a core signature of CH cells. a Schematics illustrating isolation of CH cells from the PB of naive C57Bl/6 mice for transcriptome analysis. b Venn diagram identifying the common genes resulting from pairwise comparisons between CH cells (n = 2), used as reference group, and ESC (blue), (n = 6), BM-MSC (yellow) (n = 3), HEM (gray) (n = 6), VSEL (green) (n = 3), HSC (purple) (n = 12), and MAPC (light blue) (n = 3). c The histogram shows the log2 array intensity distribution of the 87 genes significantly upregulated in CH cells in comparison to the abovementioned cell populations. d Heat map showing the z-transformed expression values of the selected 87 genes together with their clustering into the “extracellular region” and “plasma membrane” gene ontology (GO) categories, indicated in blue. The genes not comprised in these two GO categories are indicated in green. e The significant expression of Bst2 gene in CH cells was confirmed by quantitative PCR analysis, comparing the gene expression with BM-MSC and ESC (t value = 13.77, degree of freedom (df) = 7 and t value = 9.43, df = 7, respectively). ****p < 0.0001. Three independent replicates for each experimental group have been analyzed

