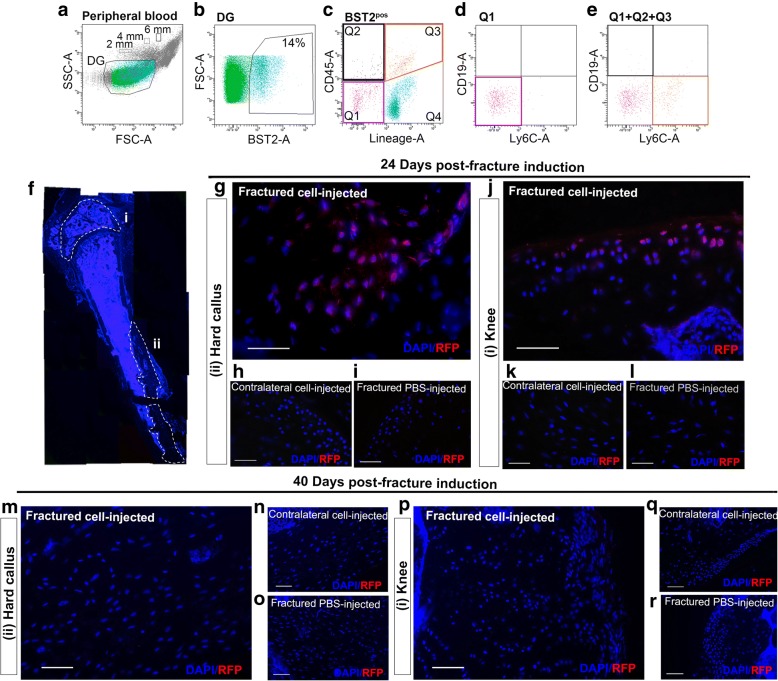
Fig. 2.
Small-sized BST2posLinnegCD45neg cells circulate in the peripheral blood and engraft within injured bone and cartilage. a–c Representative flow cytometry strategy used to identify BST2posLinnegCD45neg cells in the peripheral blood of C57Bl/6 mice (6 mice/experimental replicate; n = 15 independent experiments). DG, dimensional gate. BST2posLinnegCD45neg cells (Q1) (d) as well as the sum of events falling within the BST2posLinnegCD45neg cells (Q1), BST2posLinnegCD45pos cells (Q2), and BST2posLinposCD45pos cells (Q3) (e) were stained with the B lymphocyte marker CD19 and the macrophage/dendritic cell precursor marker Ly6C. The peripheral blood of 30 naive C57Bl/6 mice (n = 5 independent experiments) has been considered. f Serial immunofluorescence sections (magnification × 5) from the resulting callus formed 24 days after the osteotomy. #knee, °° hard callus. g–l Double fluorescence images showing signals from DAPI (blue) and RFP (red) in the hard callus (g), in the contralateral femur (h), in the articular cartilage (j), and in the contralateral articular cartilage (k) of fractured mice that received RFPpos CH cell injection 24 h post-fracture induction. Femur and articular cartilage of fractured and PBS-injected mice (i and l, respectively) were used as negative controls. Five mice/experimental group have been used. m–r Double fluorescence images showing signals from DAPI (blue) and RFP (red) in the hard callus (m), in the contralateral femur (n), in the articular cartilage (p), and in the contralateral articular cartilage (q) of fractured mice that received RFPpos CH cell injection 40 days post-fracture induction. Femur and articular cartilage of fractured and PBS-injected mice (o and r, respectively) were used as negative controls. Three mice/experimental group have been used. Magnification × 40, scale bar 50 μm

