Fig. 4.
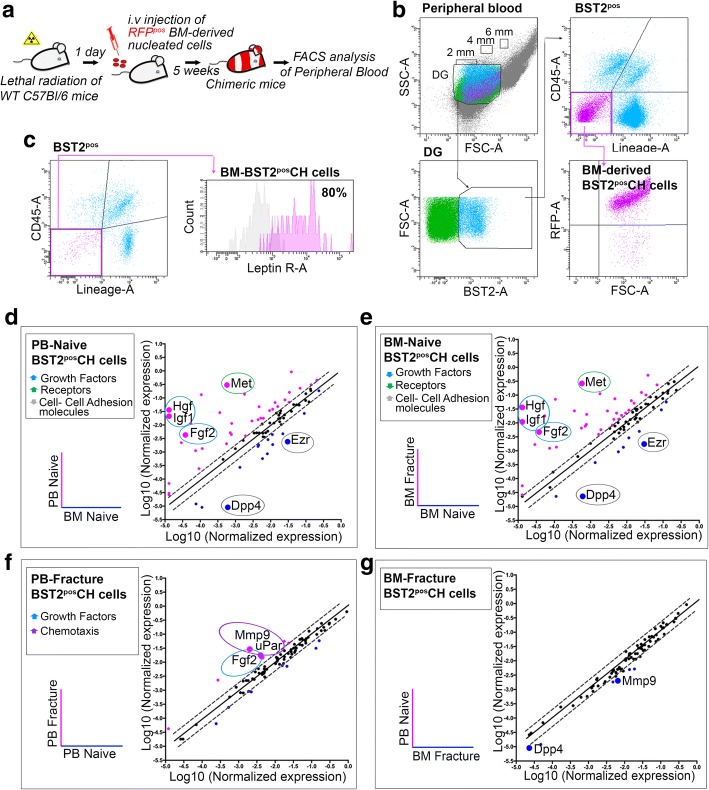
BST2pos CH cells originate from bone marrow (BM) and modify their expression profile upon injury. a Schematic depicting the experimental procedures followed to analyze PB-derived cells in chimeric mice. b Representative flow cytometry analysis of BST2pos CH cells recovered from the PB of chimeric mice (8 mice/experimental replicate; n = 3 independent experiments). c Leptin receptor (LepR) expression by BM-derived BST2posLinnegCD45neg CH cells (6 mice/experimental replicate; n = 3 independent experiments). Area under pink line identifies cells reacting with specific antigen. Area under gray line indicates the Fluorescence Minus One (FMO) control. d–g Total RNA samples derived from BST2pos CH cells isolated from the PB (n = 13) and BM (n = 10) of naive (PB-Naive and BM-Naive, respectively) and 24 h fractured (PB-Fracture (n = 13) and BM-Fracture (n = 10), respectively) mice and qRT-PCR assays were performed using Cell Motility RT2 Profiler PCR Array (3 independent experimental replicates). Each scatter plot compares the Log10 normalized expression of every gene on the array between PB-Naive (test group) and BM-Naive (reference group) (d), BM-Fracture (test group) and BM-Naive (reference group) (e), PB-Fracture (test group) and PB-Naive (reference group) (f), and PB-Naive (test group) and BM-Fracture (reference group) (g). The dashed lines indicate the diagonal and twofold change between each comparison. For each pairwise comparison, black points indicate unchanged gene expressions, pink points indicate upregulated genes, and blue points indicate downregulated genes in test groups

