
Fig. 3.
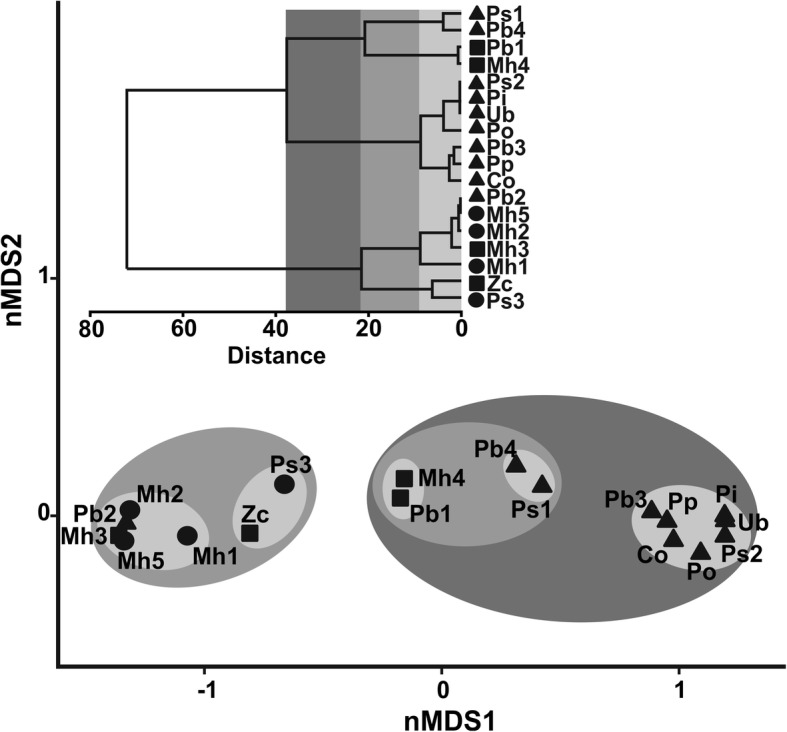
Non-metric multi-dimensional scaling plot (nMDS) and cluster analyses based on the prevalence of larval Anisakis in 18 samples (Euclidean distance) corresponding to 9 fish species in the southern South-West Atlantic. Results of a hierarchical agglomerative clustering are overlaid on the nMDS plot with similarity levels represented by a grey scale. Sample codes as in Table 1. Circles, Magellanic Province; triangles, Argentine Province; squares, ecotone zones